Excel template
COPQ Tracker PRO
Cost of poor quality per month: internal and external failure cost, % of sales, Pareto and supplier recovery in Excel
Cost of poor quality tracker for Excel: log scrap, rework, sorting, claims, downtime and premium freight, and the cost is valued from standard cost and loaded labour rates. Monthly report with % of sales and per unit, Pareto analysis, supplier recovery, optional Cost of Quality (PAF) and a dashboard. Example and blank file, no macros.
- 16 editable cost types for internal and external failure, each with a valuation rule
- Cost valued automatically: qty x standard cost + hours x loaded rate + other cost
- Monthly report: COPQ by cost type, % of sales, per unit and status vs target
- Pareto by cost type, top 10 parts and defects, by line, customer and responsible
- Supplier recovery: claimable, recovered, rejected and open claims with days open
- Optional Cost of Quality (prevention, appraisal, failure) and an 8-tile dashboard
Secure checkout by Polar. Digital download: at checkout you agree to immediate delivery and waive the 14-day withdrawal right, so downloads are not refunded. Support: info@qmbench.com.
Free alternativeTry the free online tool firstThe free Cost of Poor Quality (COPQ) Calculator on QM Bench runs in your browser with a PDF report. The template is for a file you keep, edit and fill with your own data.Open the free toolWhat is inside
- 1
Start Here
5-step guide, valuation rules and colour legend.
- 2
Setup
Company, fiscal year start month, COPQ target, loaded labour and downtime rates, cost types with valuation rules and lists.
- 3
Parts
300 part numbers with standard cost per unit, used to value scrap and returns.
- 4
Cost Log
1,500 rows: one per quality event, automatic valuation, internal / external category, net cost after supplier recovery and a Row Check.
- 5
Monthly Inputs
Sales and units produced per month, optional prevention and appraisal cost.
- 6
Monthly Report
12 months of COPQ by cost type, internal and external, recovered, net COPQ, % of sales, per unit, vs target and Cost of Quality.
- 7
Analysis
Pareto by cost type, top 10 parts and defects, by line, customer and responsible, year to date or any month.
- 8
Supplier Recovery
Charge-backs per supplier and the list of open claims to chase, largest first.
- 9
Dashboard
8 KPI tiles and 6 charts for the monthly quality review.
Try the template in your browser
The same split as the COPQ Tracker: internal and external failure cost, appraisal and prevention, failure cost as % of sales and a Pareto.
DemoIllustrative preview with example data, not the template itself. The Excel file has more rows, tabs, charts and checks.
| Cost item | Category | Cost |
|---|---|---|
| Sales this month |
The PRO workbook adds a cost register by month, cause and supplier, supplier recovery, a 12-month trend and the dashboard.
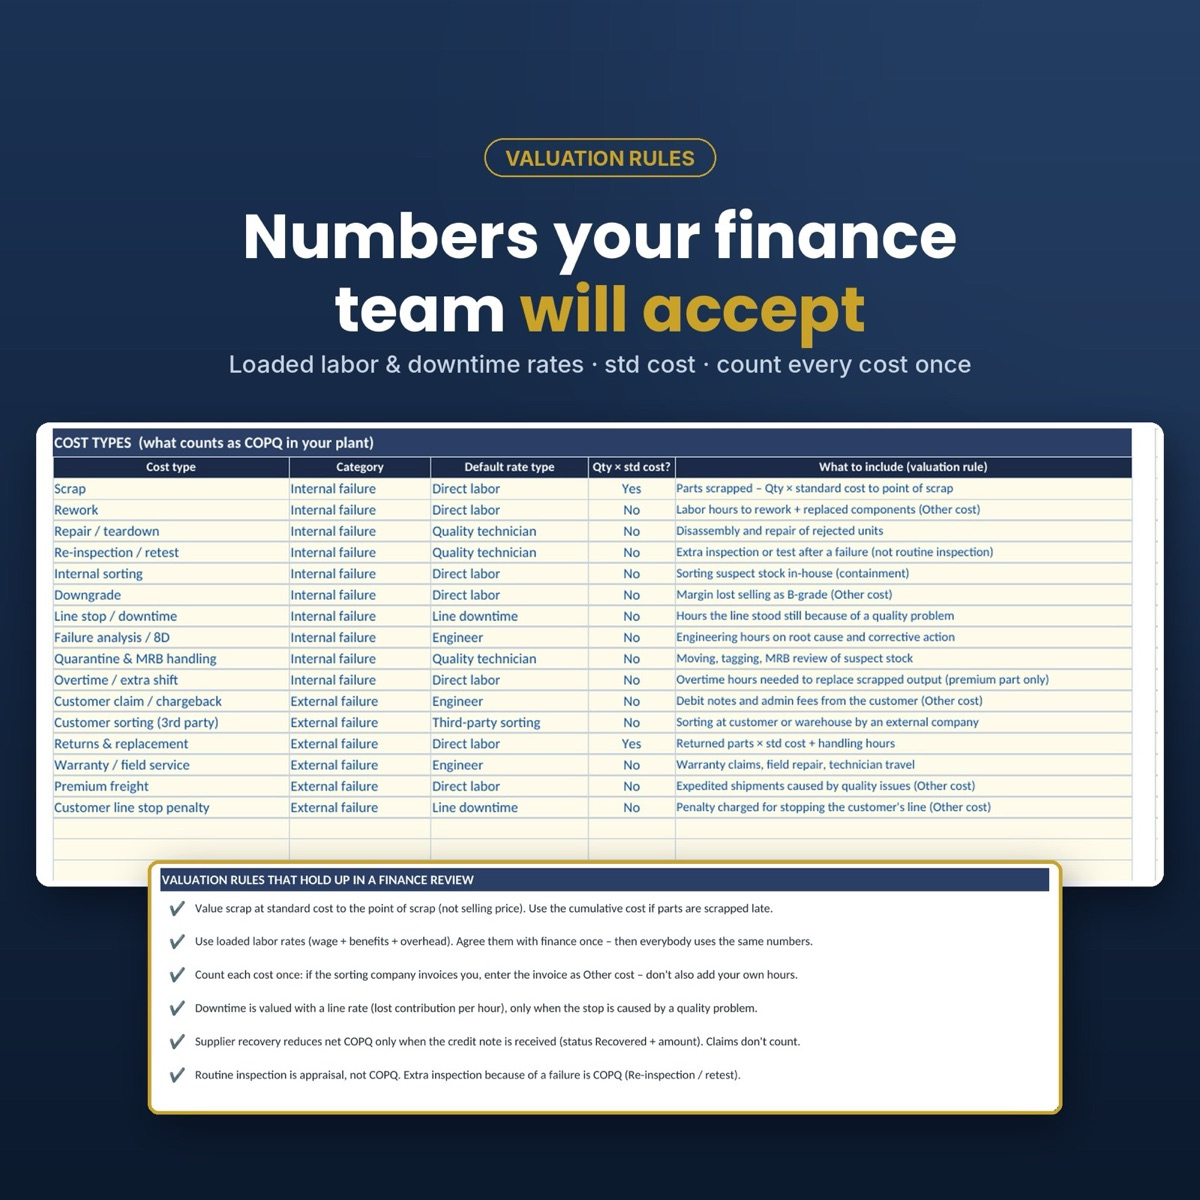
Numbers your finance team accepts
Scrap at standard cost to the point of scrap, loaded labour rates agreed once, every cost counted once, downtime valued only when quality caused it, and supplier recovery counted only when the credit note arrives.
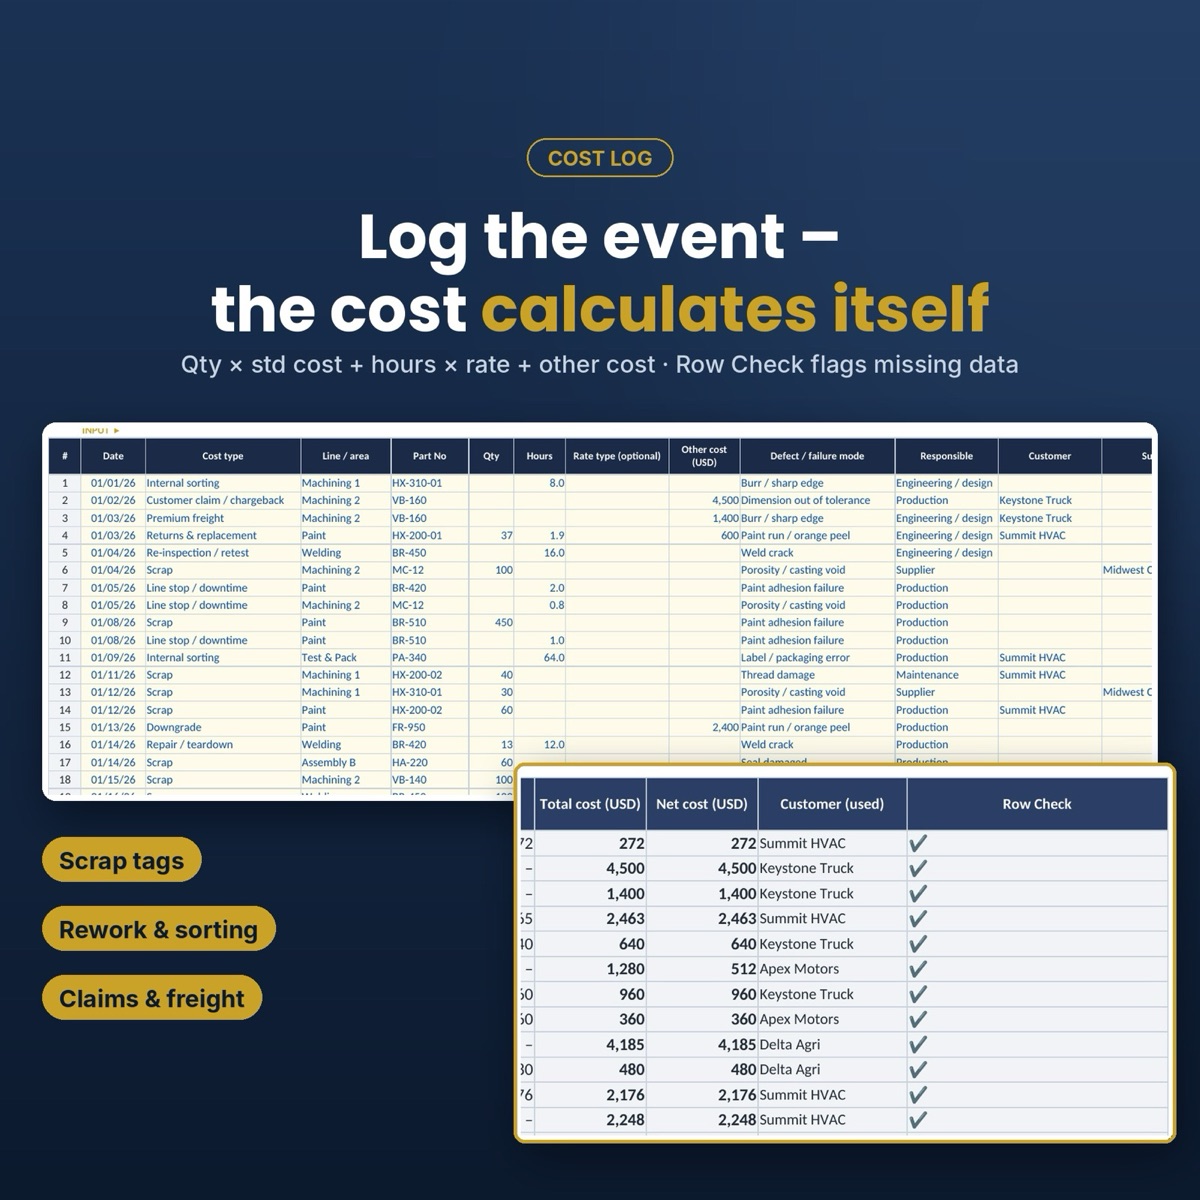
Log the event, the cost calculates itself
Pick the cost type, part and line, enter quantity or hours and any invoice amount. The value, category and net cost follow, and the Row Check flags missing data.
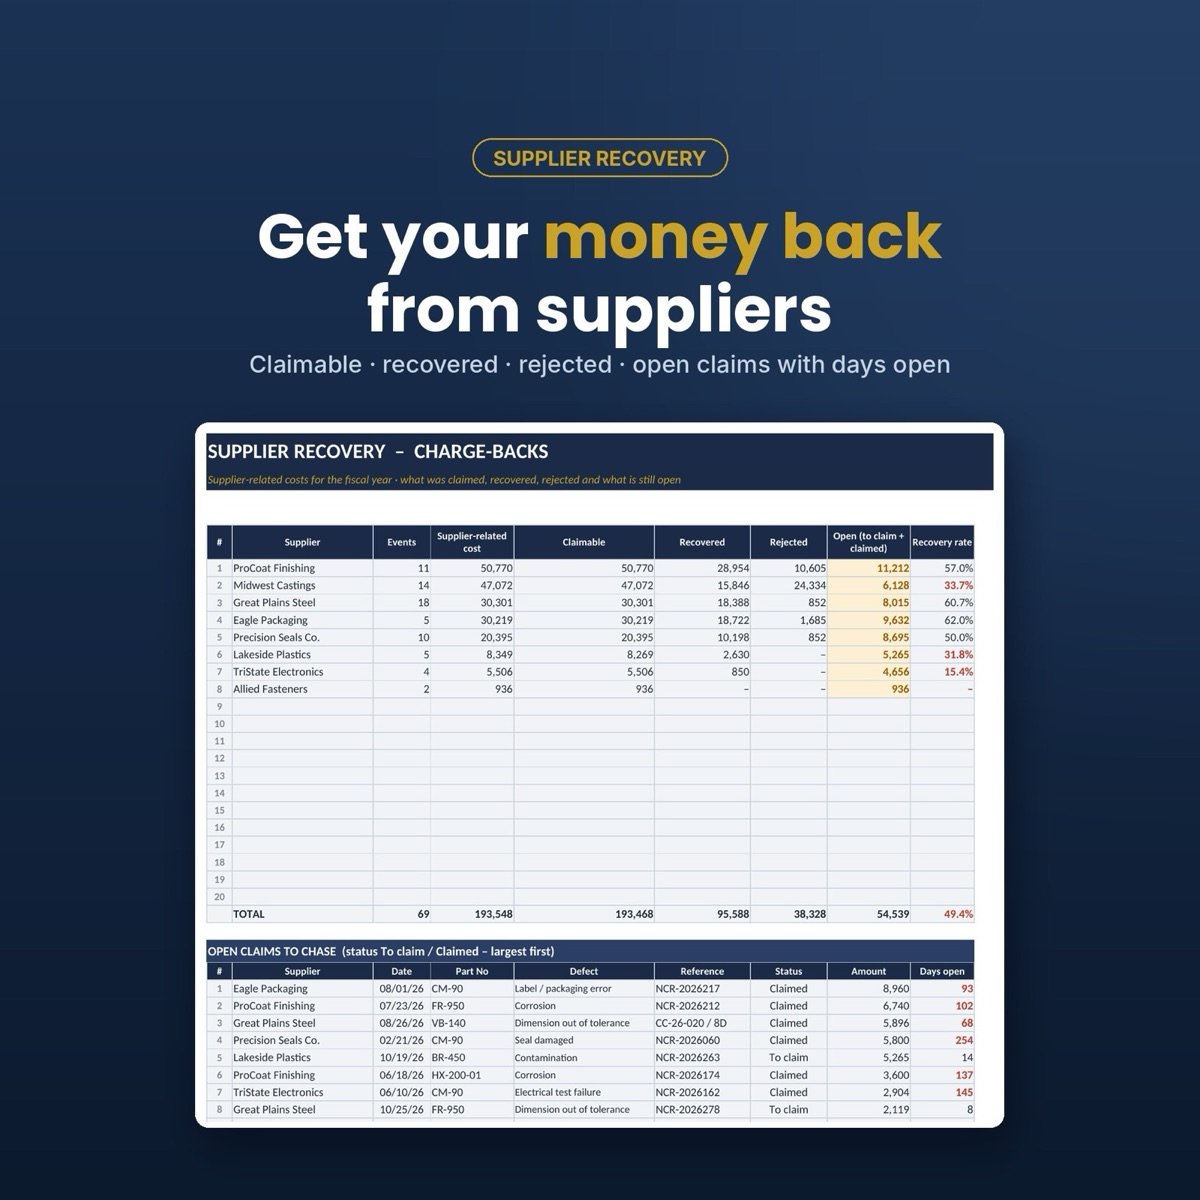
Get your money back from suppliers
Every supplier-related cost shows as claimable, recovered, rejected or open, with the open claims listed largest first and the days they have been open.
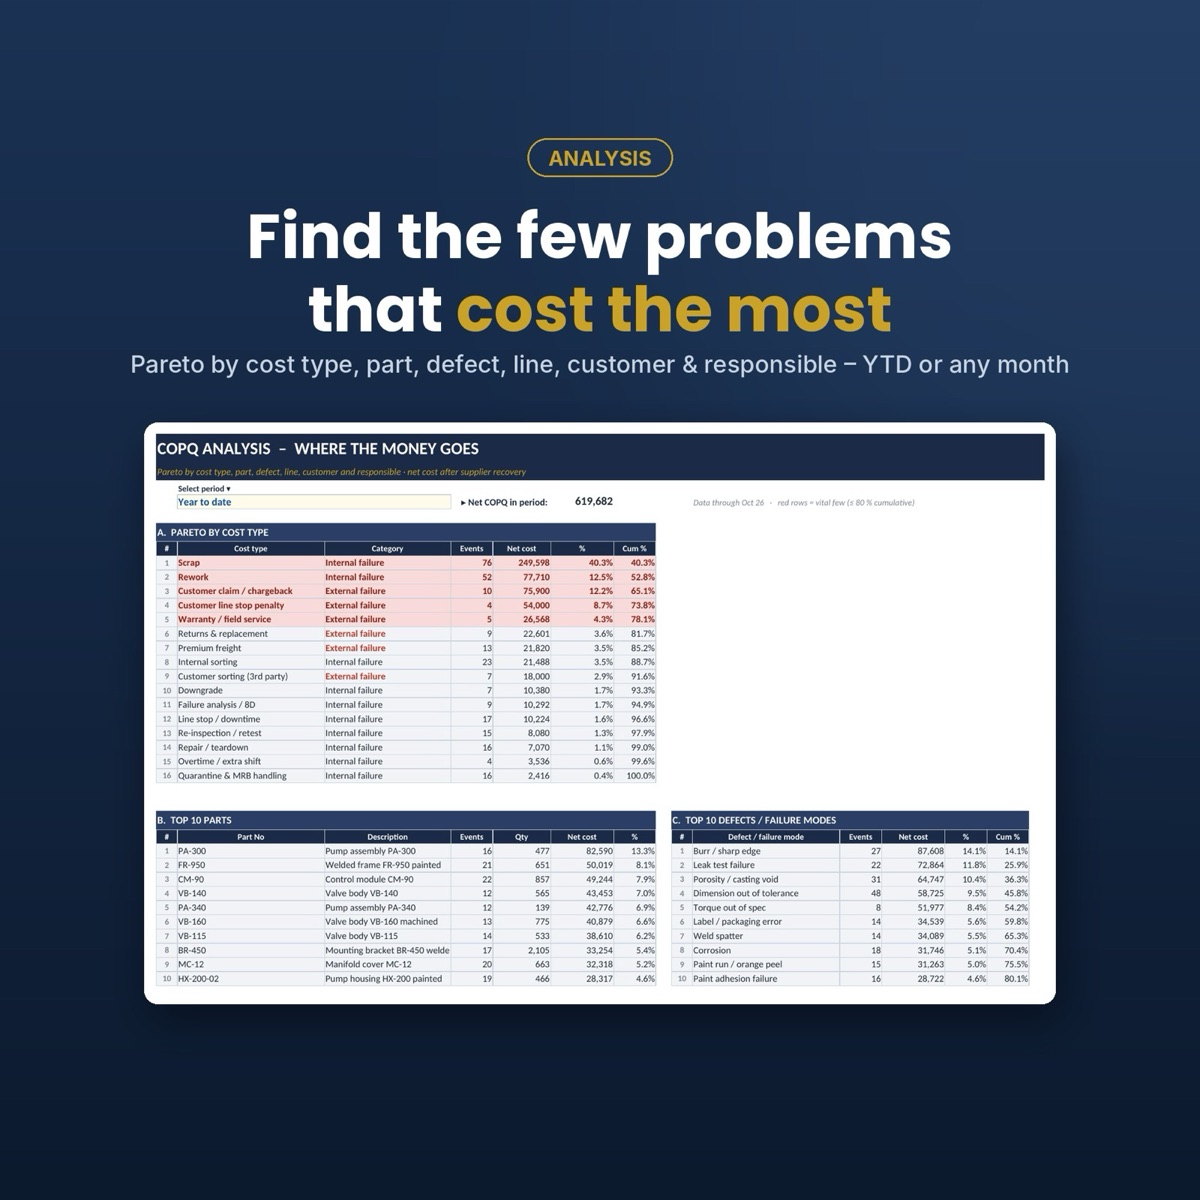
Find the few problems that cost the most
The Pareto ranks cost types, parts, defects, lines, customers and responsible areas for the year to date or any month, with the vital few highlighted.
Who it is for
- Quality managers and quality engineers reporting COPQ monthly
- Plant managers and controllers who need quality cost in money
- Continuous improvement and Six Sigma teams sizing projects
- Suppliers tracking quality cost as a KPI under IATF 16949 or ISO 9001
Not included
- An ERP connection (data is entered or pasted)
- Macros, VBA or add-ins
- Identical charts in Google Sheets (data entry works, some charts differ)
Details
- Format
- Microsoft Excel .xlsx, 2 files, 9 tabs
- Works in
- Excel 2010 or newer, Microsoft 365, Excel for Mac, LibreOffice Calc
- Macros
- None
- Capacity
- 1,500 cost events, 300 parts, 16 cost types, 12 months
- Sample data
- Full fiscal year: 283 events, 20 parts, 8 suppliers
- Currency
- Set once in Setup; fiscal year can start in any month
- Delivery
- Instant download after payment
Frequently asked questions
›Where do I buy it?
Here on QM Bench with the Buy button: secure card checkout by Polar with a receipt, and the two Excel files arrive by e-mail right after payment.
›Is there a free alternative?
Yes. The free COPQ calculator on QM Bench values a cost register in your browser with a PDF. The Excel tracker adds a 1,500-row log, monthly reporting against sales, supplier recovery and the dashboard in a file you keep.
›Can I get a refund?
No. It is a digital download: at checkout you agree to immediate delivery and waive the 14-day right of withdrawal, and the file stays with you. If something does not work as described, write to info@qmbench.com and you will get help or a corrected file.
Get the COPQ Tracker PRO
Instant download by e-mail after payment. Paste your measurements and read the verdict.
Buy now · €15.99Or try the free online tool first →