Excel template
FPY & RTY Tracker PRO
First pass yield per step, rolled throughput yield per line, hidden factory and defect Pareto in Excel
First pass yield and rolled throughput yield tracker for Excel: routing for up to 6 lines x 12 steps, a 3,000-row production log, a 4,000-row defect log, a dashboard with RTY, normalized yield, hidden factory and cost, a monthly yield report and an analysis by step, shift and line. Example and blank file, no macros.
- FPY per step and RTY per line, weighted by volume
- Dashboard with line and period filter: RTY, normalized yield, throughput yield, worst step, hidden factory, scrap rate and cost
- Routing for up to 6 lines x 12 steps with FPY targets and standard cost
- 3,000-row production log and 4,000-row defect log with coverage check
- Monthly yield report and analysis by step, shift and line
- Full-year example (3 lines, 15 steps) and a blank file
Secure checkout by Polar. Digital download: at checkout you agree to immediate delivery and waive the 14-day withdrawal right, so downloads are not refunded. Support: info@qmbench.com.
Free alternativeTry the free online tool firstThe free First Pass Yield (FPY) Calculator on QM Bench runs in your browser with a PDF report. The template is for a file you keep, edit and fill with your own data.Open the free toolWhat is inside
- 1
Start Here
4-step guide, counting rules and colour legend.
- 2
Dashboard
Pick line and period: 8 KPI tiles, weekly RTY trend, FPY by step, defect Pareto and RTY by line.
- 3
Setup
Year, RTY target, labour rate, routing per line, steps with FPY target, standard cost and rework minutes.
- 4
Production Log
Date, line, step, shift, units in, scrap and rework; first-pass good, FPY and Row Check calculate.
- 5
Defect Log
Defect code, quantity and disposition per step, with a coverage check against scrap and rework.
- 6
Yield Report
FPY of every step by month, RTY vs target, normalized yield, units started, scrap, rework and hidden factory per 100 units.
- 7
Analysis
FPY vs target per step with gap and cost, defect Pareto, FPY by shift and a comparison of all lines.
Try the template in your browser
The same calculation as the FPY & RTY Tracker: first pass yield per step and rolled throughput yield for the line.
DemoIllustrative preview with example data, not the template itself. The Excel file has more rows, tabs, charts and checks.
| Step | Units in | Good first time | FPY |
|---|---|---|---|
| 96.2 % | |||
| 99.3 % | |||
| 95.6 % | |||
| 97.5 % |
| FPY target (%) |
The PRO workbook tracks this per day and per line, with a defect Pareto, hidden factory cost and monthly trend charts.
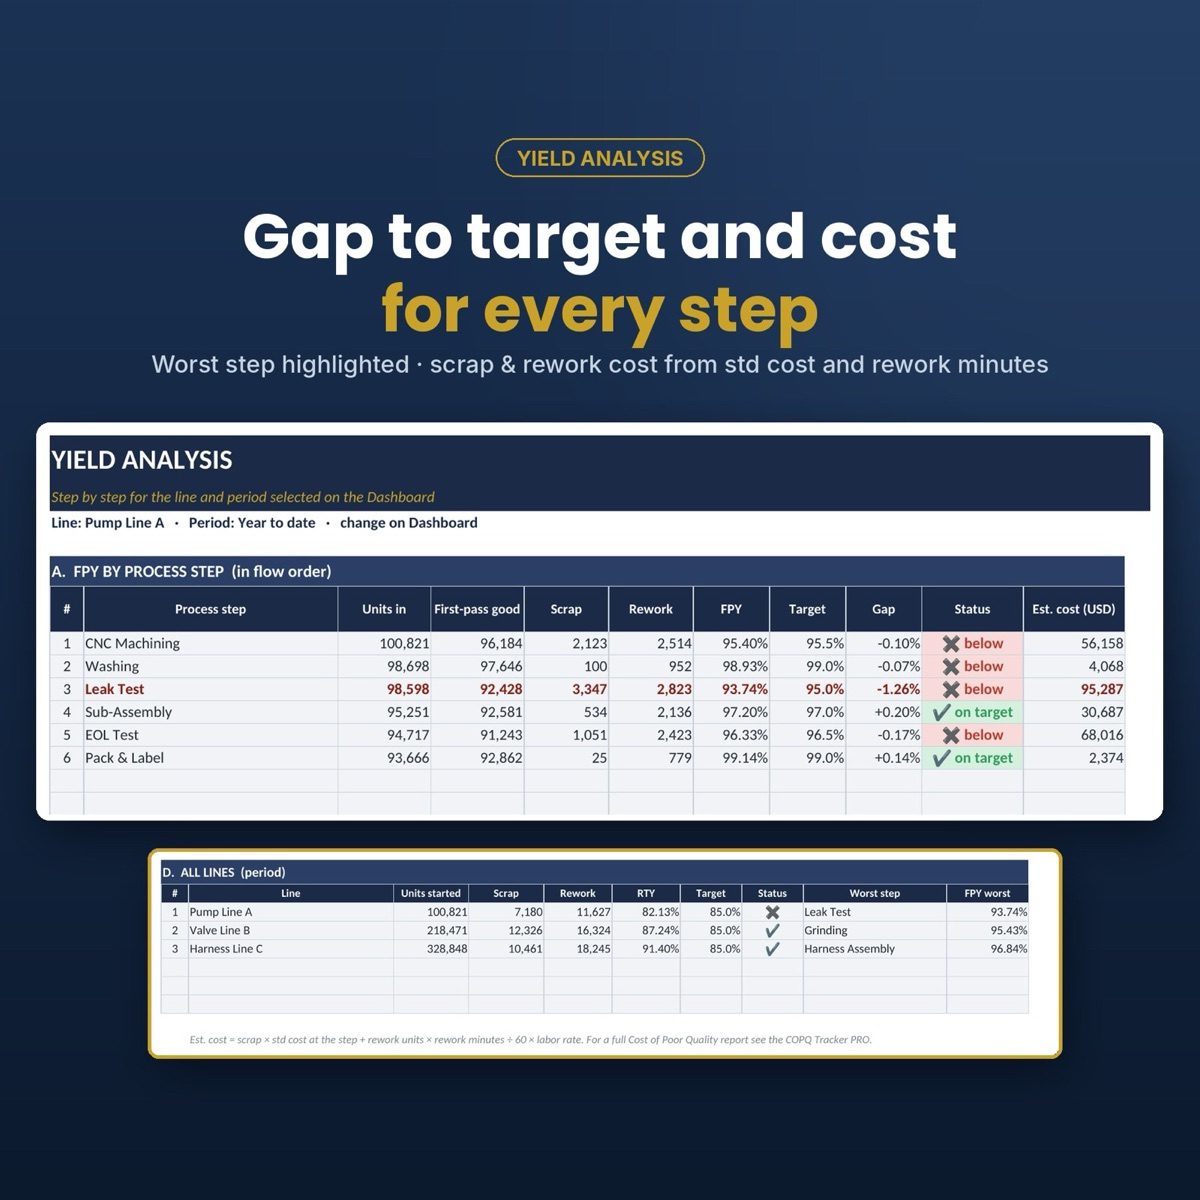
Find the step that kills your yield
RTY multiplies the FPY of every step, so one weak step drags the whole line down. The dashboard names the worst step and shows the gap to target and its cost.
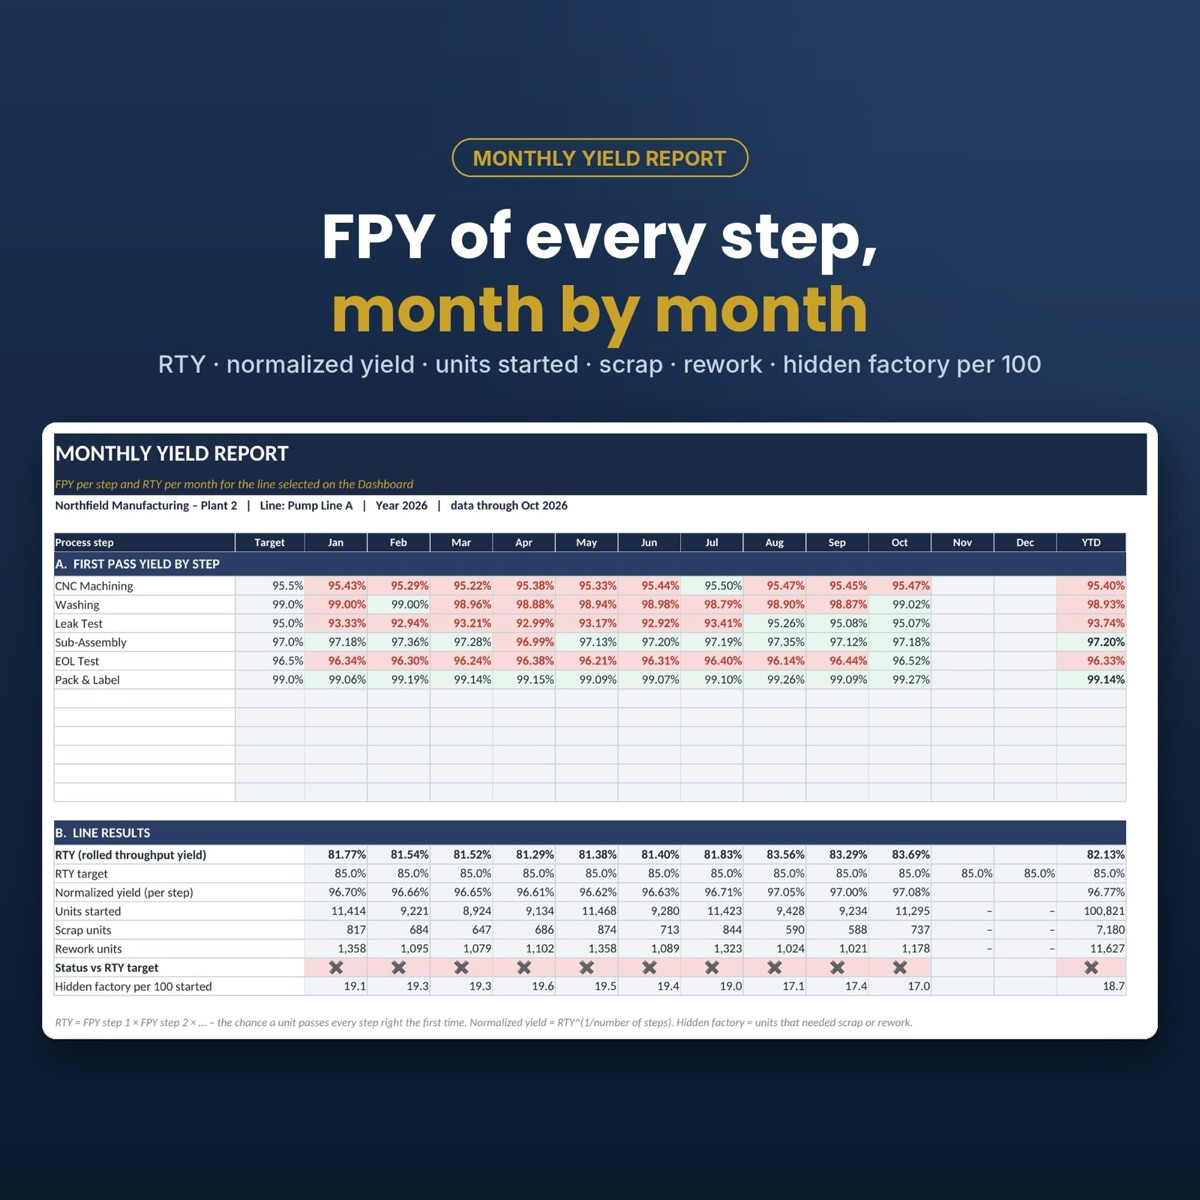
From log to report without formulas
Enter units in, scrap and rework per step and shift. First-pass good, FPY, the monthly yield report and the hidden factory per 100 units follow.
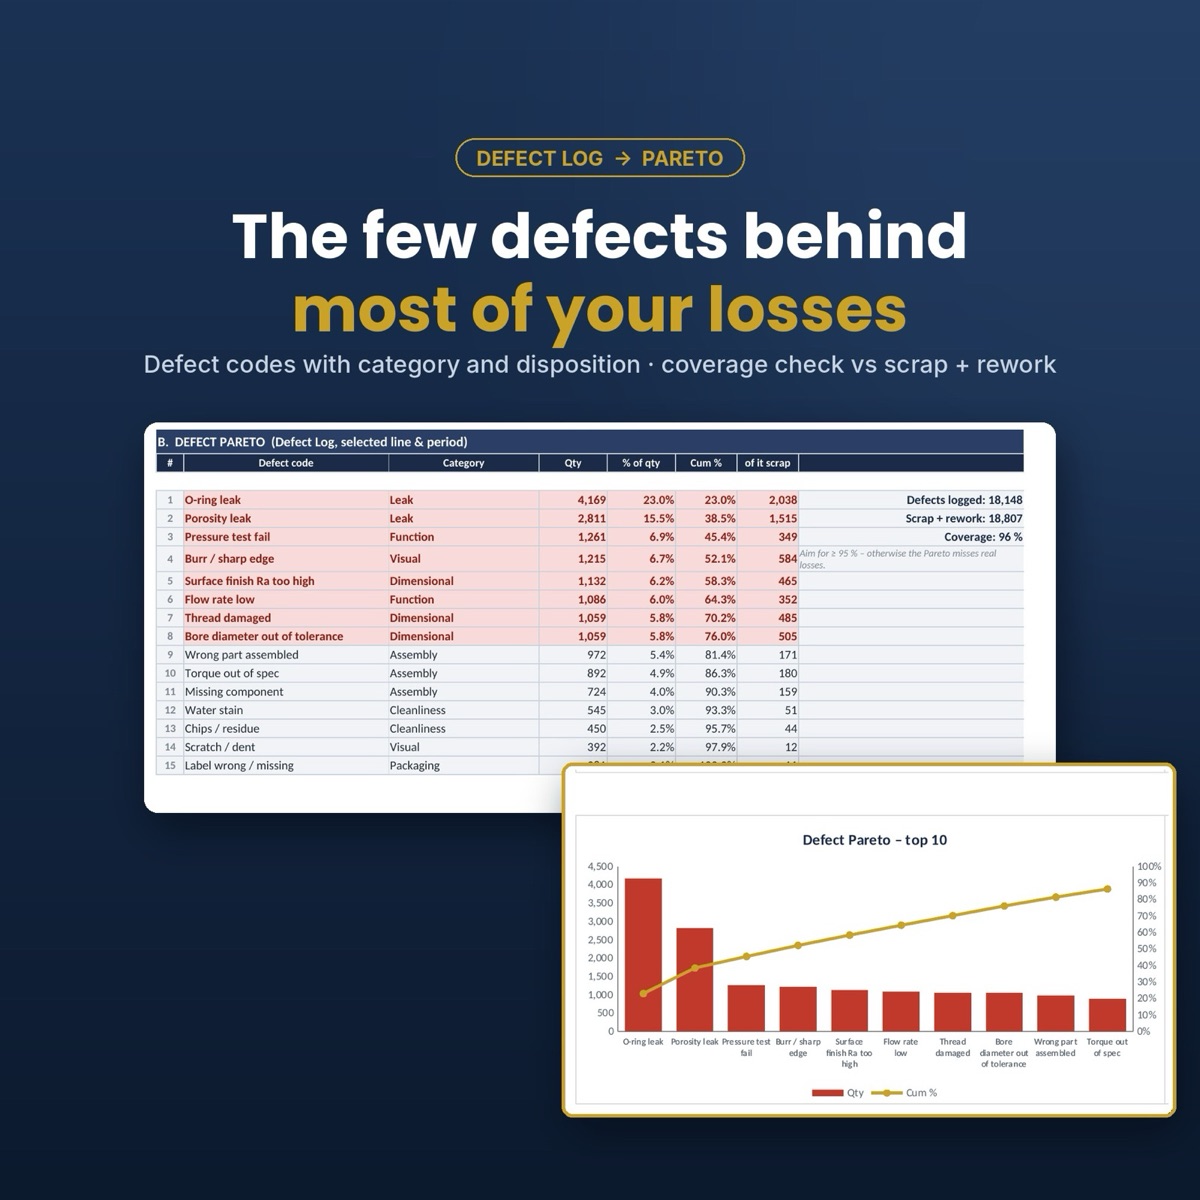
Defects with a cost
The defect log adds a code and disposition to every loss; the Pareto shows which defect costs the most, and a coverage check flags scrap or rework without a defect booked.
How it calculates
FPY = (units in - scrap - rework) / units in, weighted by volume. RTY = FPY step 1 x FPY step 2 x ... x FPY step n. Normalized yield = RTY^(1/n). Cost = scrap x standard cost + rework units x rework minutes x labour rate.
Who it is for
- Quality engineers and quality managers in manufacturing
- Production and process engineers running multi-step lines
- Lean Six Sigma Green Belts and Black Belts
- Suppliers who report yield KPIs under IATF 16949 or ISO 9001
Not included
- An MES or ERP connection (data is entered or pasted)
- Macros, VBA or add-ins
- Identical charts in Google Sheets (data entry works, some charts differ)
Details
- Format
- Microsoft Excel .xlsx, 2 files, 7 tabs
- Works in
- Excel 2010 or newer, Microsoft 365, Excel for Mac, LibreOffice Calc
- Macros
- None
- Capacity
- 6 lines x 12 steps, 3,000 production rows, 4,000 defect rows
- Sample data
- Full year: 3 lines, 15 steps, 1,980 log rows, 3,091 defect rows
- Period
- One file per calendar year
- Delivery
- Instant download after payment
Frequently asked questions
›Where do I buy it?
Here on QM Bench with the Buy button: secure card checkout by Polar with a receipt, and the two Excel files arrive by e-mail right after payment.
›How is it different from the free First Pass Yield Report?
The free report tracks FPY and RTY for one process. The PRO tracker adds routing for 6 lines, production and defect logs, a dashboard with line and period filter, hidden factory and cost, a monthly yield report and the analysis by step, shift and line.
›Can I get a refund?
No. It is a digital download: at checkout you agree to immediate delivery and waive the 14-day right of withdrawal, and the file stays with you. If something does not work as described, write to info@qmbench.com and you will get help or a corrected file.
Get the FPY & RTY Tracker PRO
Instant download by e-mail after payment. Paste your measurements and read the verdict.
Buy now · €5.90Or try the free online tool first →