Excel template
Process Capability Calculator
Cp, Cpk, Pp, Ppk, sigma level and PPM in one Excel dashboard
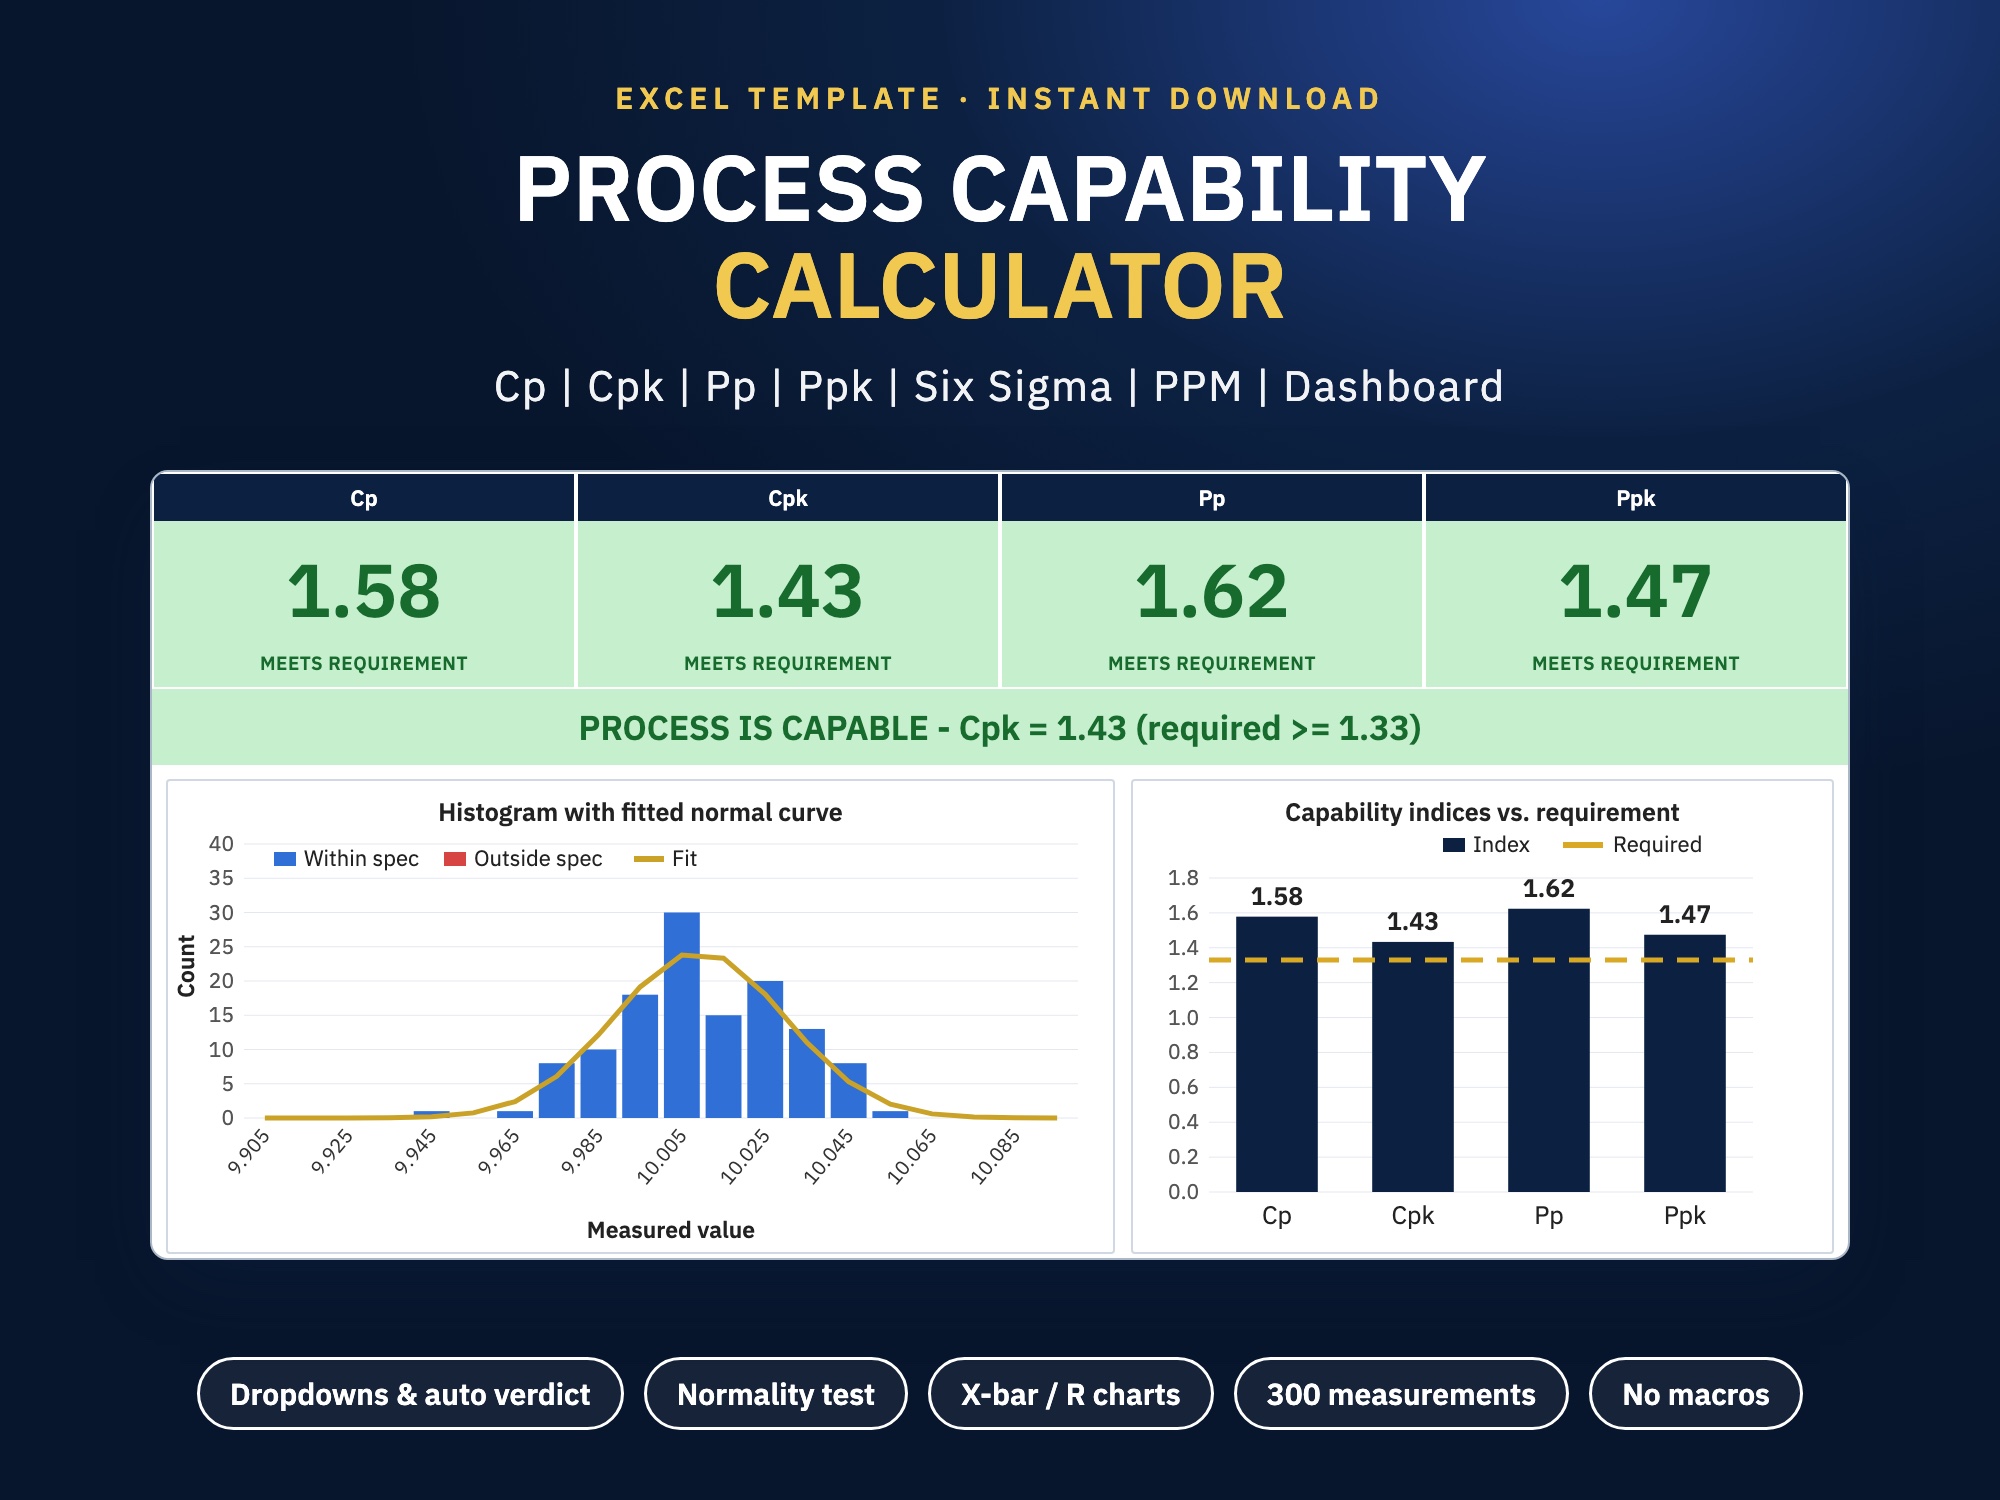
Paste your measurements and get Cp, Cpk, Pp, Ppk, sigma level and expected PPM on one dashboard, with an X-bar / R stability check, an Anderson-Darling normality test and a plain-English verdict that warns you when the result should not be trusted. Five sheets, no macros, Excel 2010 or newer.
- Cp, Cpk, Pp, Ppk, CPU, CPL, PPU, PPL, Z bench, sigma level and PPM
- Verdict with warnings for unstable, non-normal, off-centre and small studies
- X-bar and R charts with automatic limits, histogram with normal curve
- Anderson-Darling normality test with p-value
- Two-sided or one-sided specification, subgroup size 2 to 10, up to 300 values
- No macros, every formula visible, Excel 2010 or newer
What is inside
- 1
Start Here
Four-step instructions and an overview of the file.
- 2
Data Entry
Setup block with dropdowns and a grid for up to 30 subgroups × 10 values. Every row shows OK or Check n.
- 3
Dashboard
KPI tiles with status colours, verdict, histogram, indices chart, X-bar chart, R chart and a full results table.
- 4
Guide
Formulas, interpretation table for Cpk 1.00 / 1.33 / 1.67 / 2.00, the constants d2, A2, D3, D4 and good practice.
- 5
Calc
The open calculation sheet. Every formula is visible, nothing is hidden or locked.
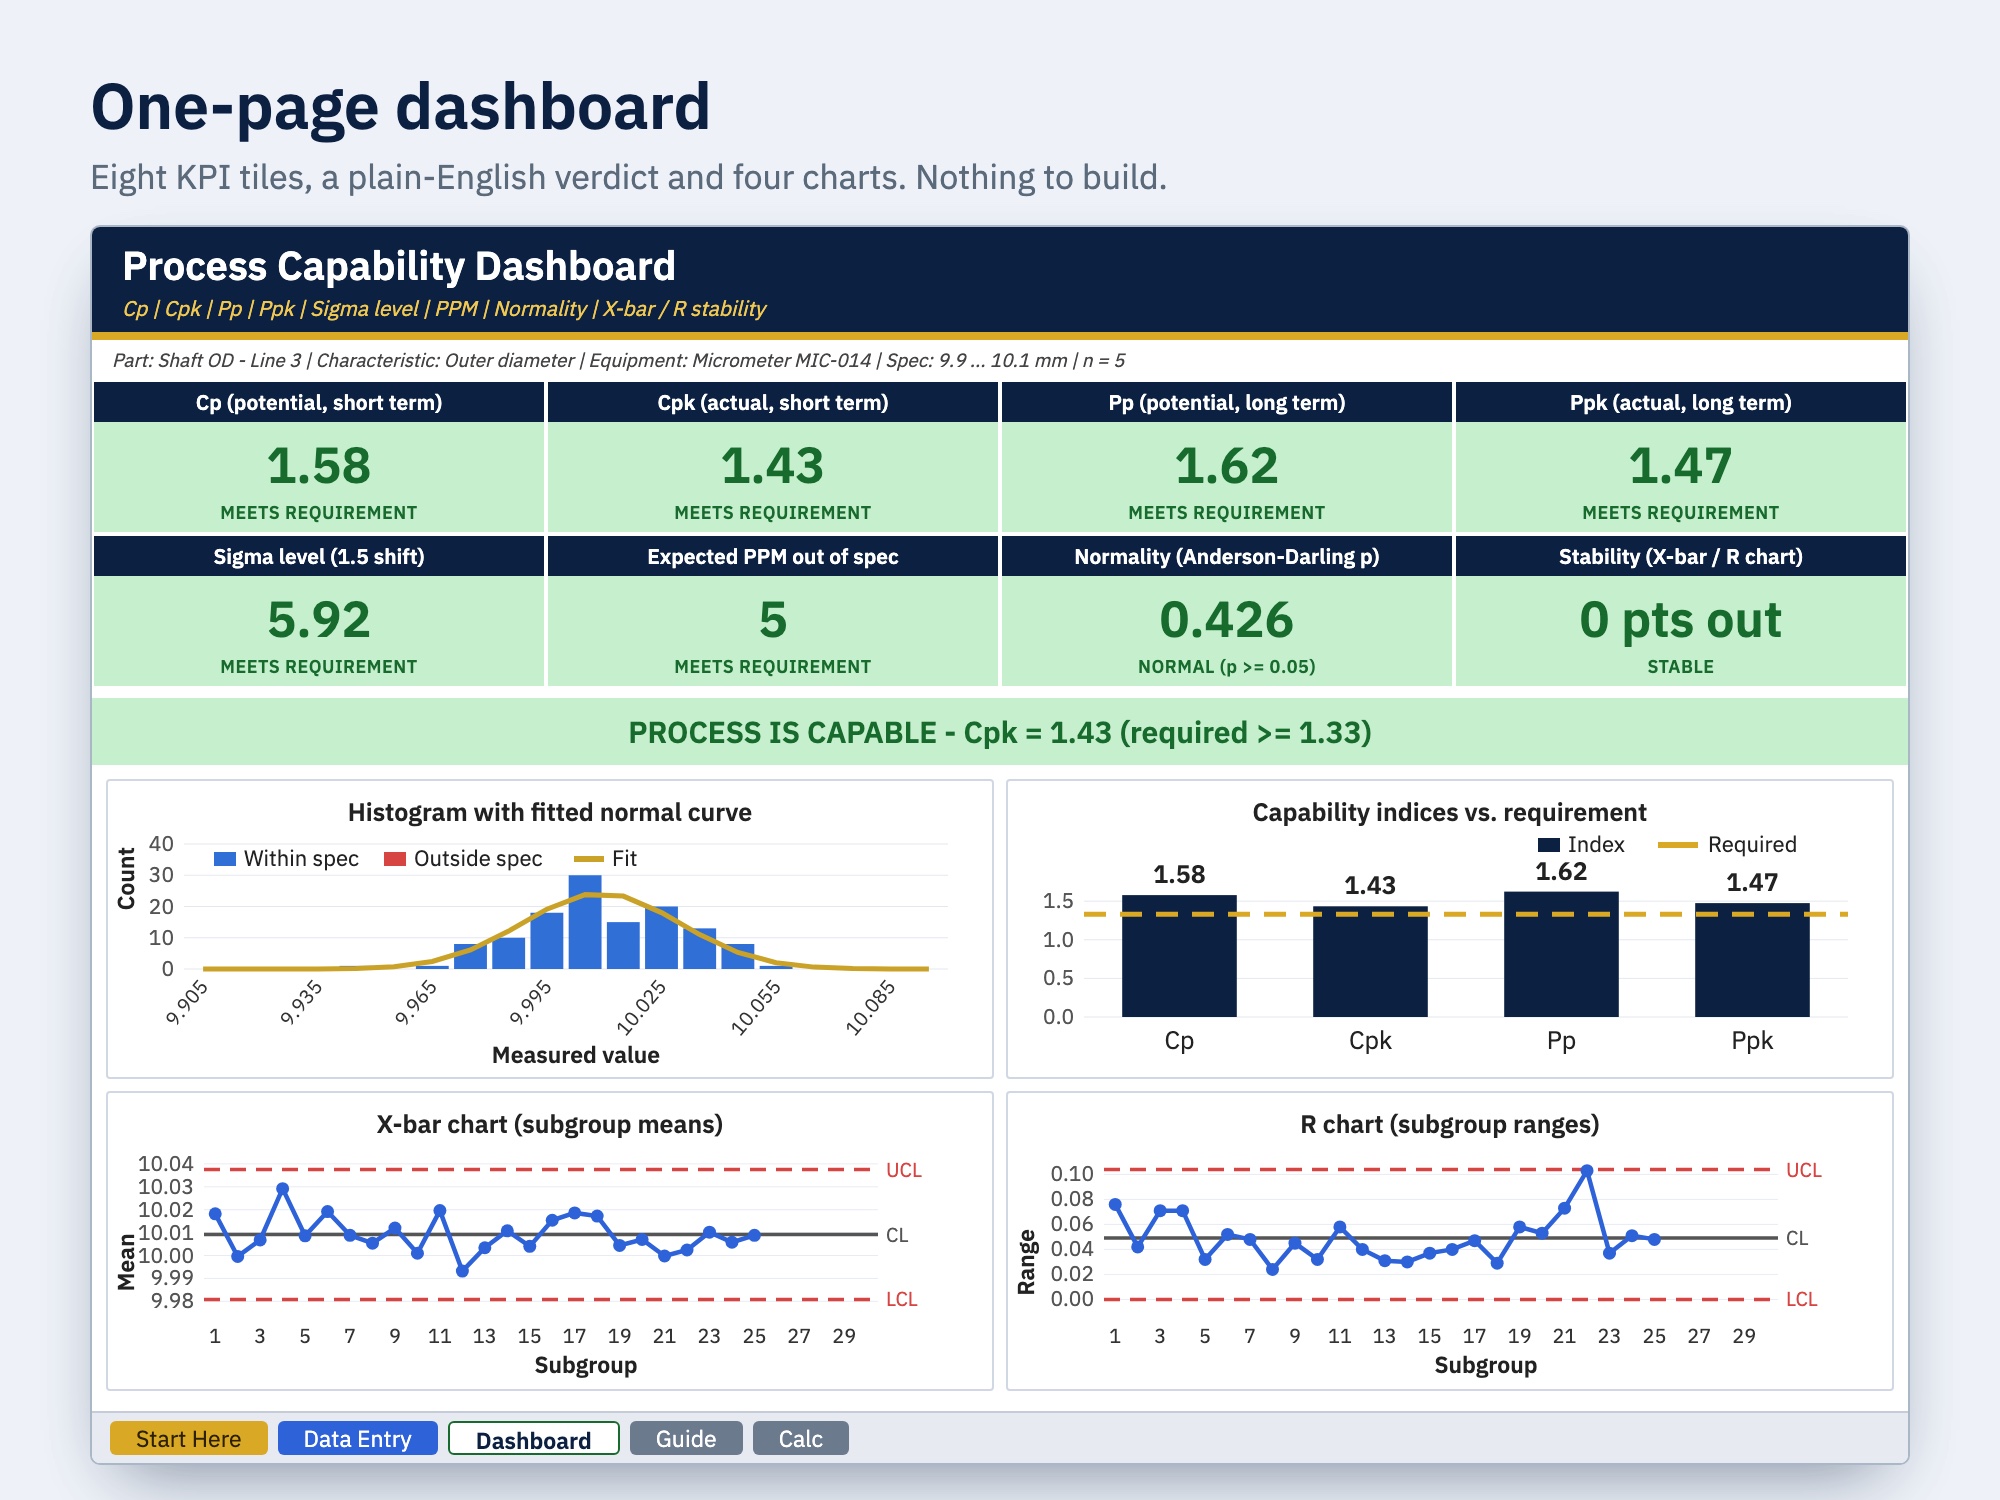
One-page dashboard
Eight KPI tiles with green, amber and red status, a verdict sentence and four charts. Short-term (Cp, Cpk) and long-term (Pp, Ppk) capability sit side by side, with the required index drawn into the chart.
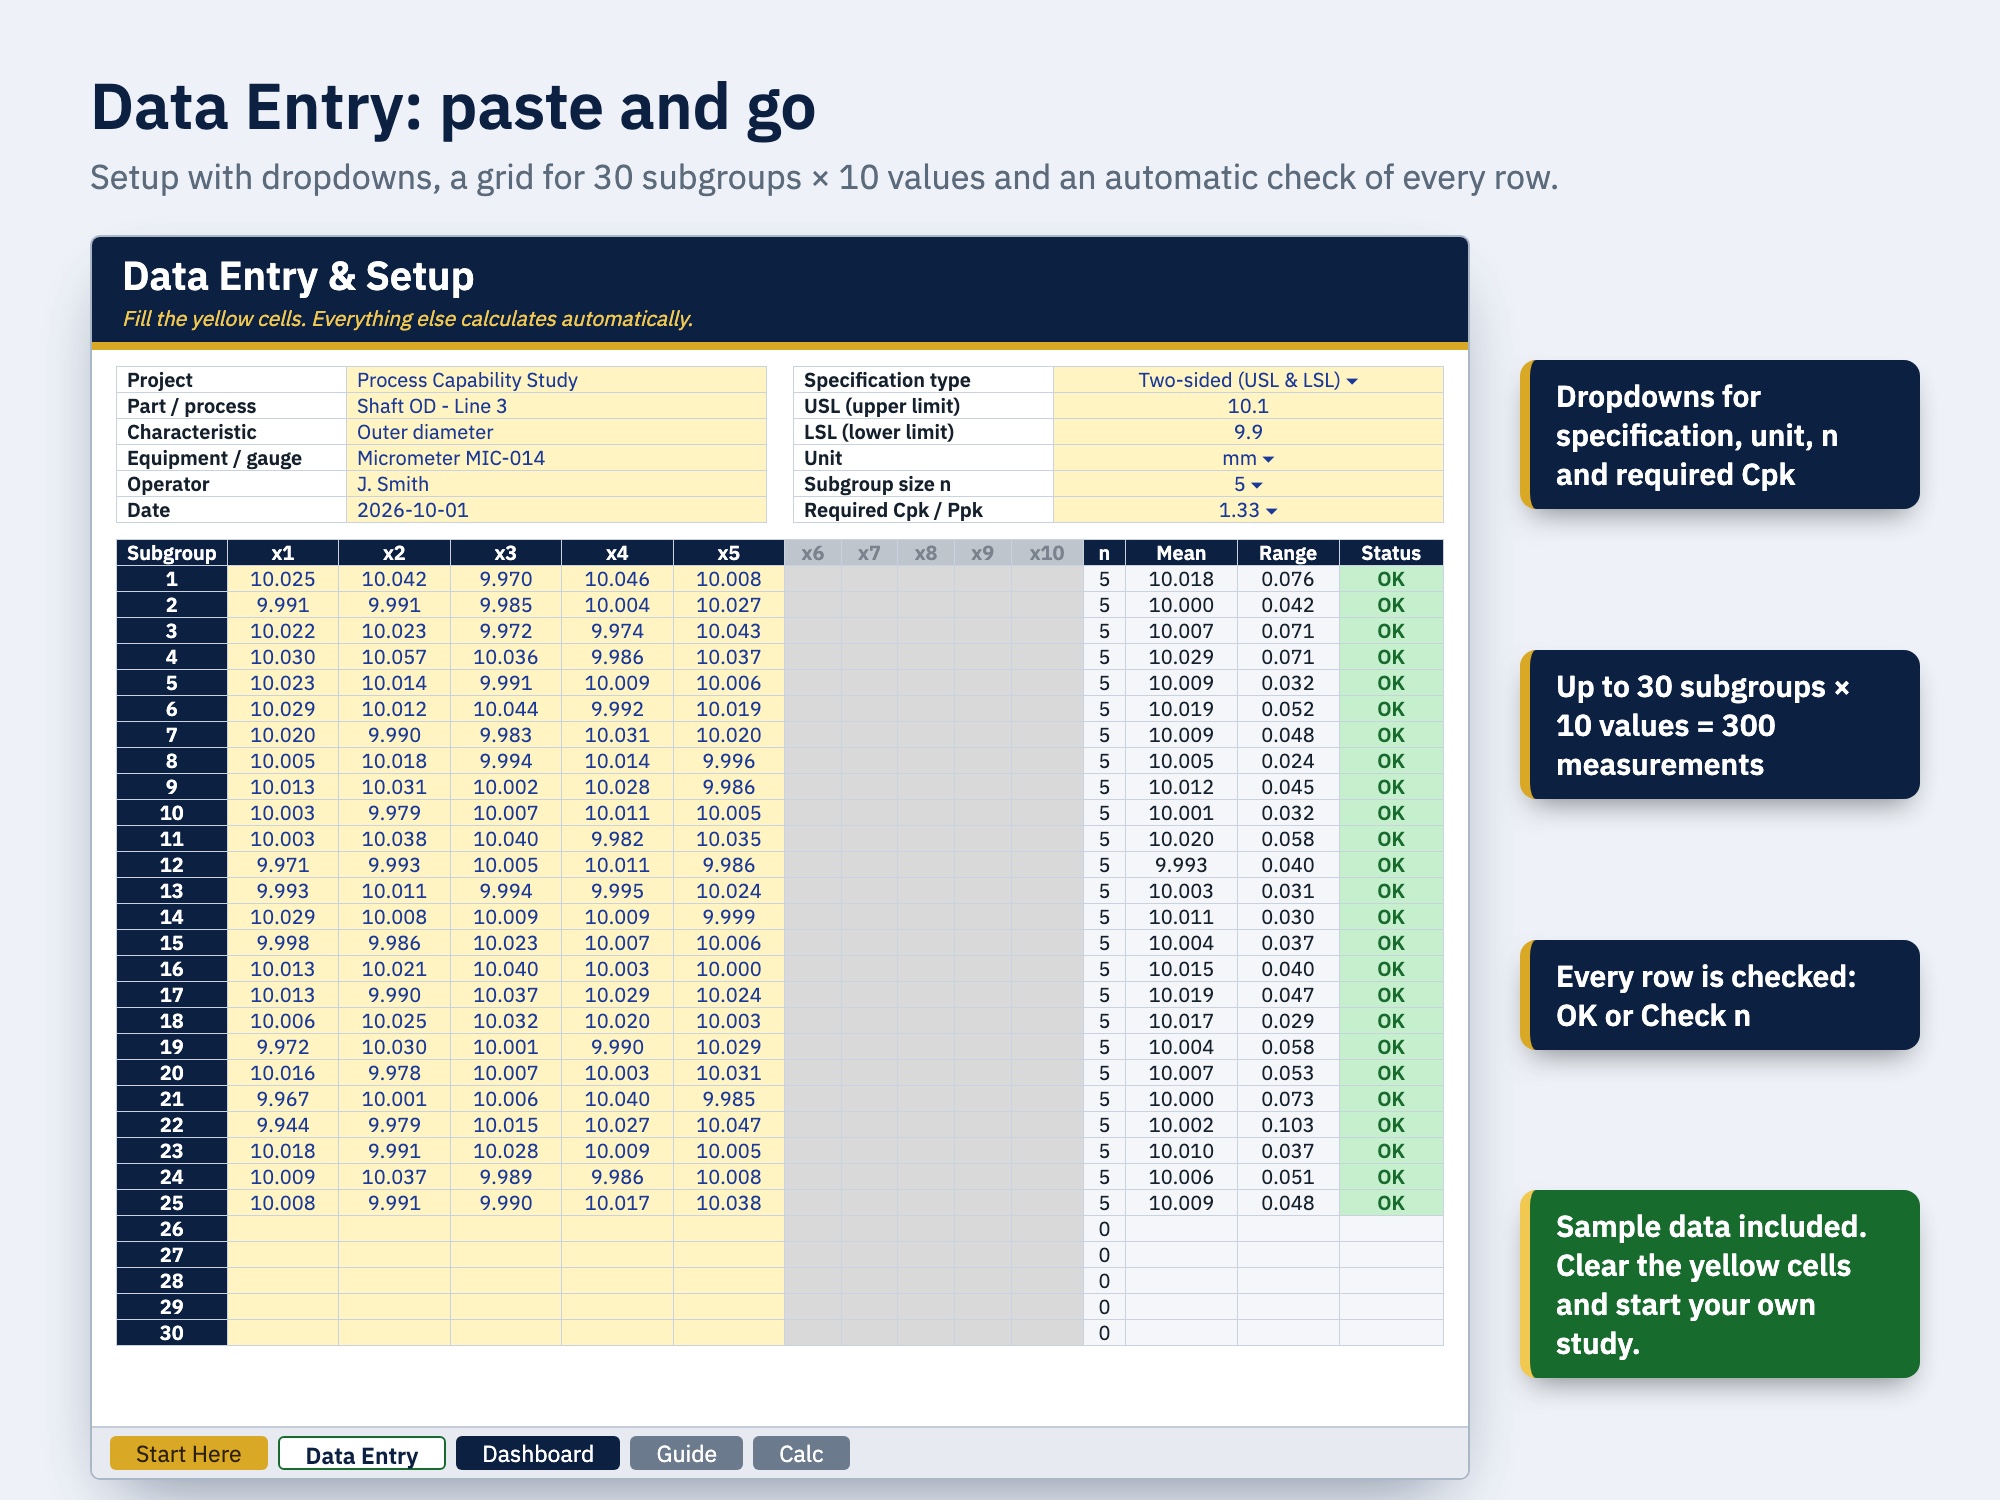
Paste and go
Describe the study, pick the specification type, subgroup size and required Cpk from dropdowns and paste up to 300 measurements. Every row is checked: OK, or Check n when it does not have exactly n values.
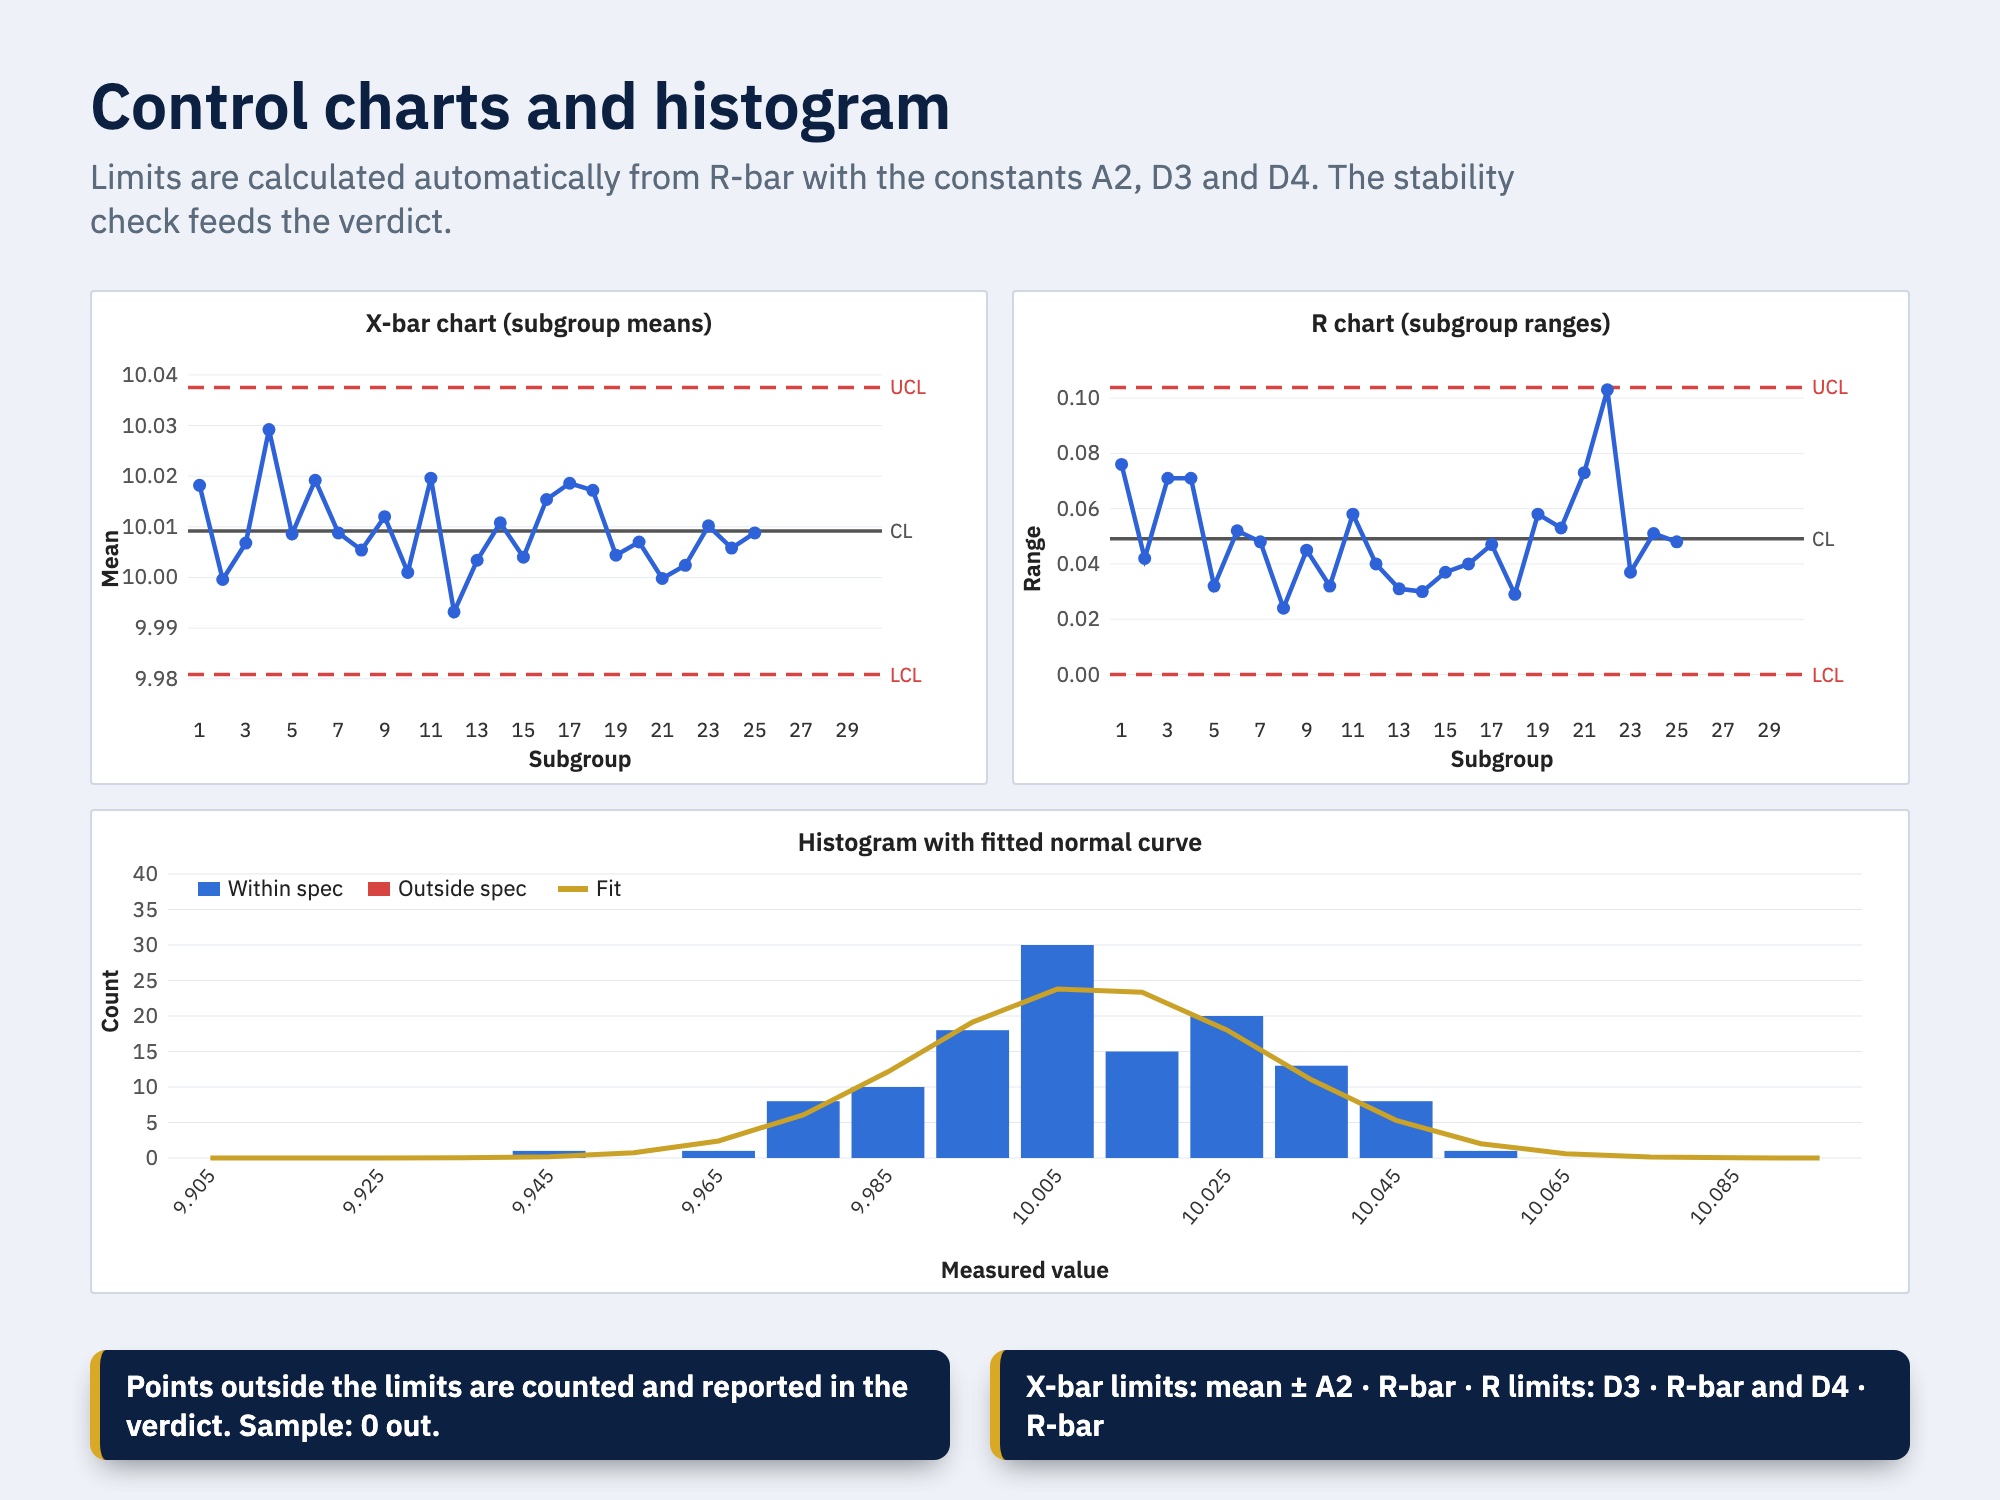
Control charts and normality
X-bar and R chart limits come from R-bar with the constants A2, D3 and D4. The Anderson-Darling test gives A² and a p-value, and the histogram shows the fitted normal curve against the specification limits.
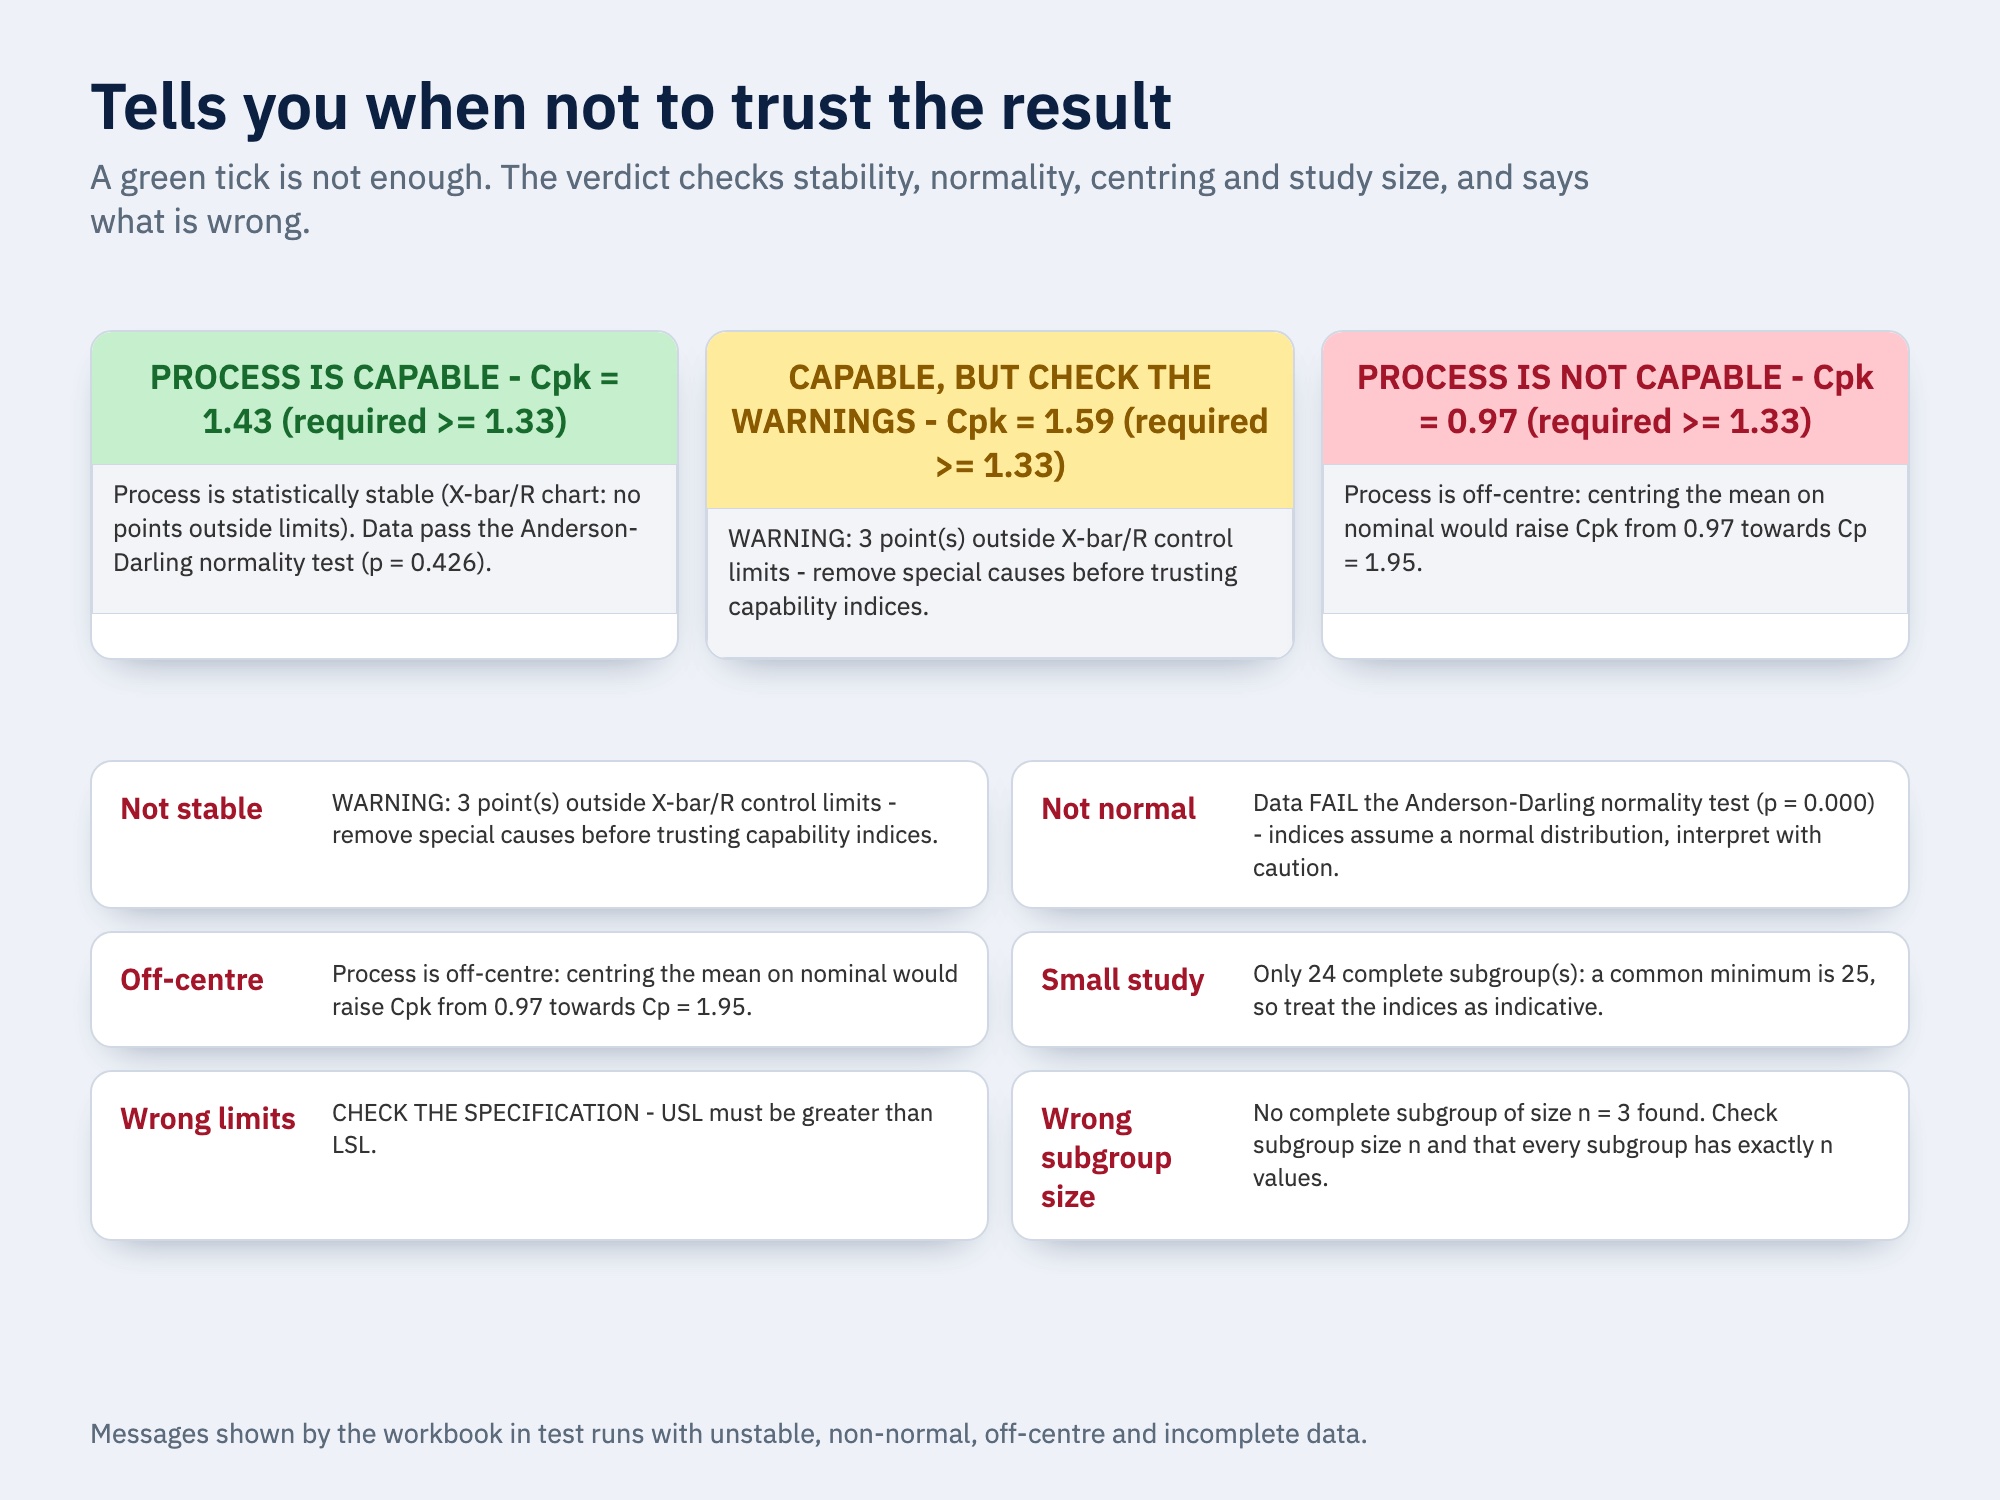
Tells you when not to trust the result
A green number is not enough. The verdict turns amber when the process is not stable or the data are not normal, and it explains off-centre processes, small studies and input mistakes in plain English.
Verified calculations
All formulas were recalculated independently and match to at least 10 significant digits. The workbook was tested with subgroup sizes 2 to 10, one-sided limits and incomplete, unstable and non-normal data.
Honest scope
An X-bar / R study with subgroups of 2 to 10. There is no individuals (I-MR) chart, and stability is judged by points outside the control limits. For individuals or subgroups above 10, use the free online tool.
Details
- Format
- Microsoft Excel .xlsx, 5 sheets
- Works in
- Excel 2010 or newer (Windows, Mac)
- Macros
- None
- Study size
- 2 to 10 per subgroup, up to 30 subgroups
- Specification
- Two-sided or one-sided
- Required Cpk / Ppk
- Dropdown 1.00 to 2.00 or your own value
- Charts
- Histogram, indices, X-bar, R
- Sample data
- Pre-loaded, 25 subgroups of 5
- Delivery
- Instant download from Etsy
Frequently asked questions
›Where do I buy it?
On Etsy, in the ManageManufacturing shop. You get the Excel file as an instant download after payment.
›Is there a free alternative?
Yes. The free Process Capability tool on QM Bench calculates Cp, Cpk, Pp and Ppk in your browser with control charts and a PDF report. The Excel template is for those who want everything in a file they can keep, edit and fill with their own data.
›Does it work in Google Sheets or LibreOffice?
It is built for Microsoft Excel 2010 or newer on Windows and Mac. It has not been tested in Google Sheets or LibreOffice.
›Which subgroup sizes and charts are supported?
Subgroups of 2 to 10 with X-bar and R charts, up to 30 subgroups. Individuals charts and subgroups above 10 are not included; the free online tool supports them.
›Can I use my own required Cpk?
Yes. Pick 1.00, 1.33, 1.50, 1.67 or 2.00 from the dropdown, or type your own value and confirm the notice that it is not in the list.
›How is stability judged?
The dashboard counts X-bar and R points outside the control limits and warns when there are any. Run rules such as the Nelson rules are not part of the workbook; the free online tool applies all eight.
›Can I return it?
Instant downloads cannot be returned or exchanged on Etsy. If something does not work, message the seller from the listing and you will get help.
Get the Process Capability Calculator
Instant download from Etsy. Paste your measurements and read the verdict.
Get it on EtsyOr try the free online tool first →