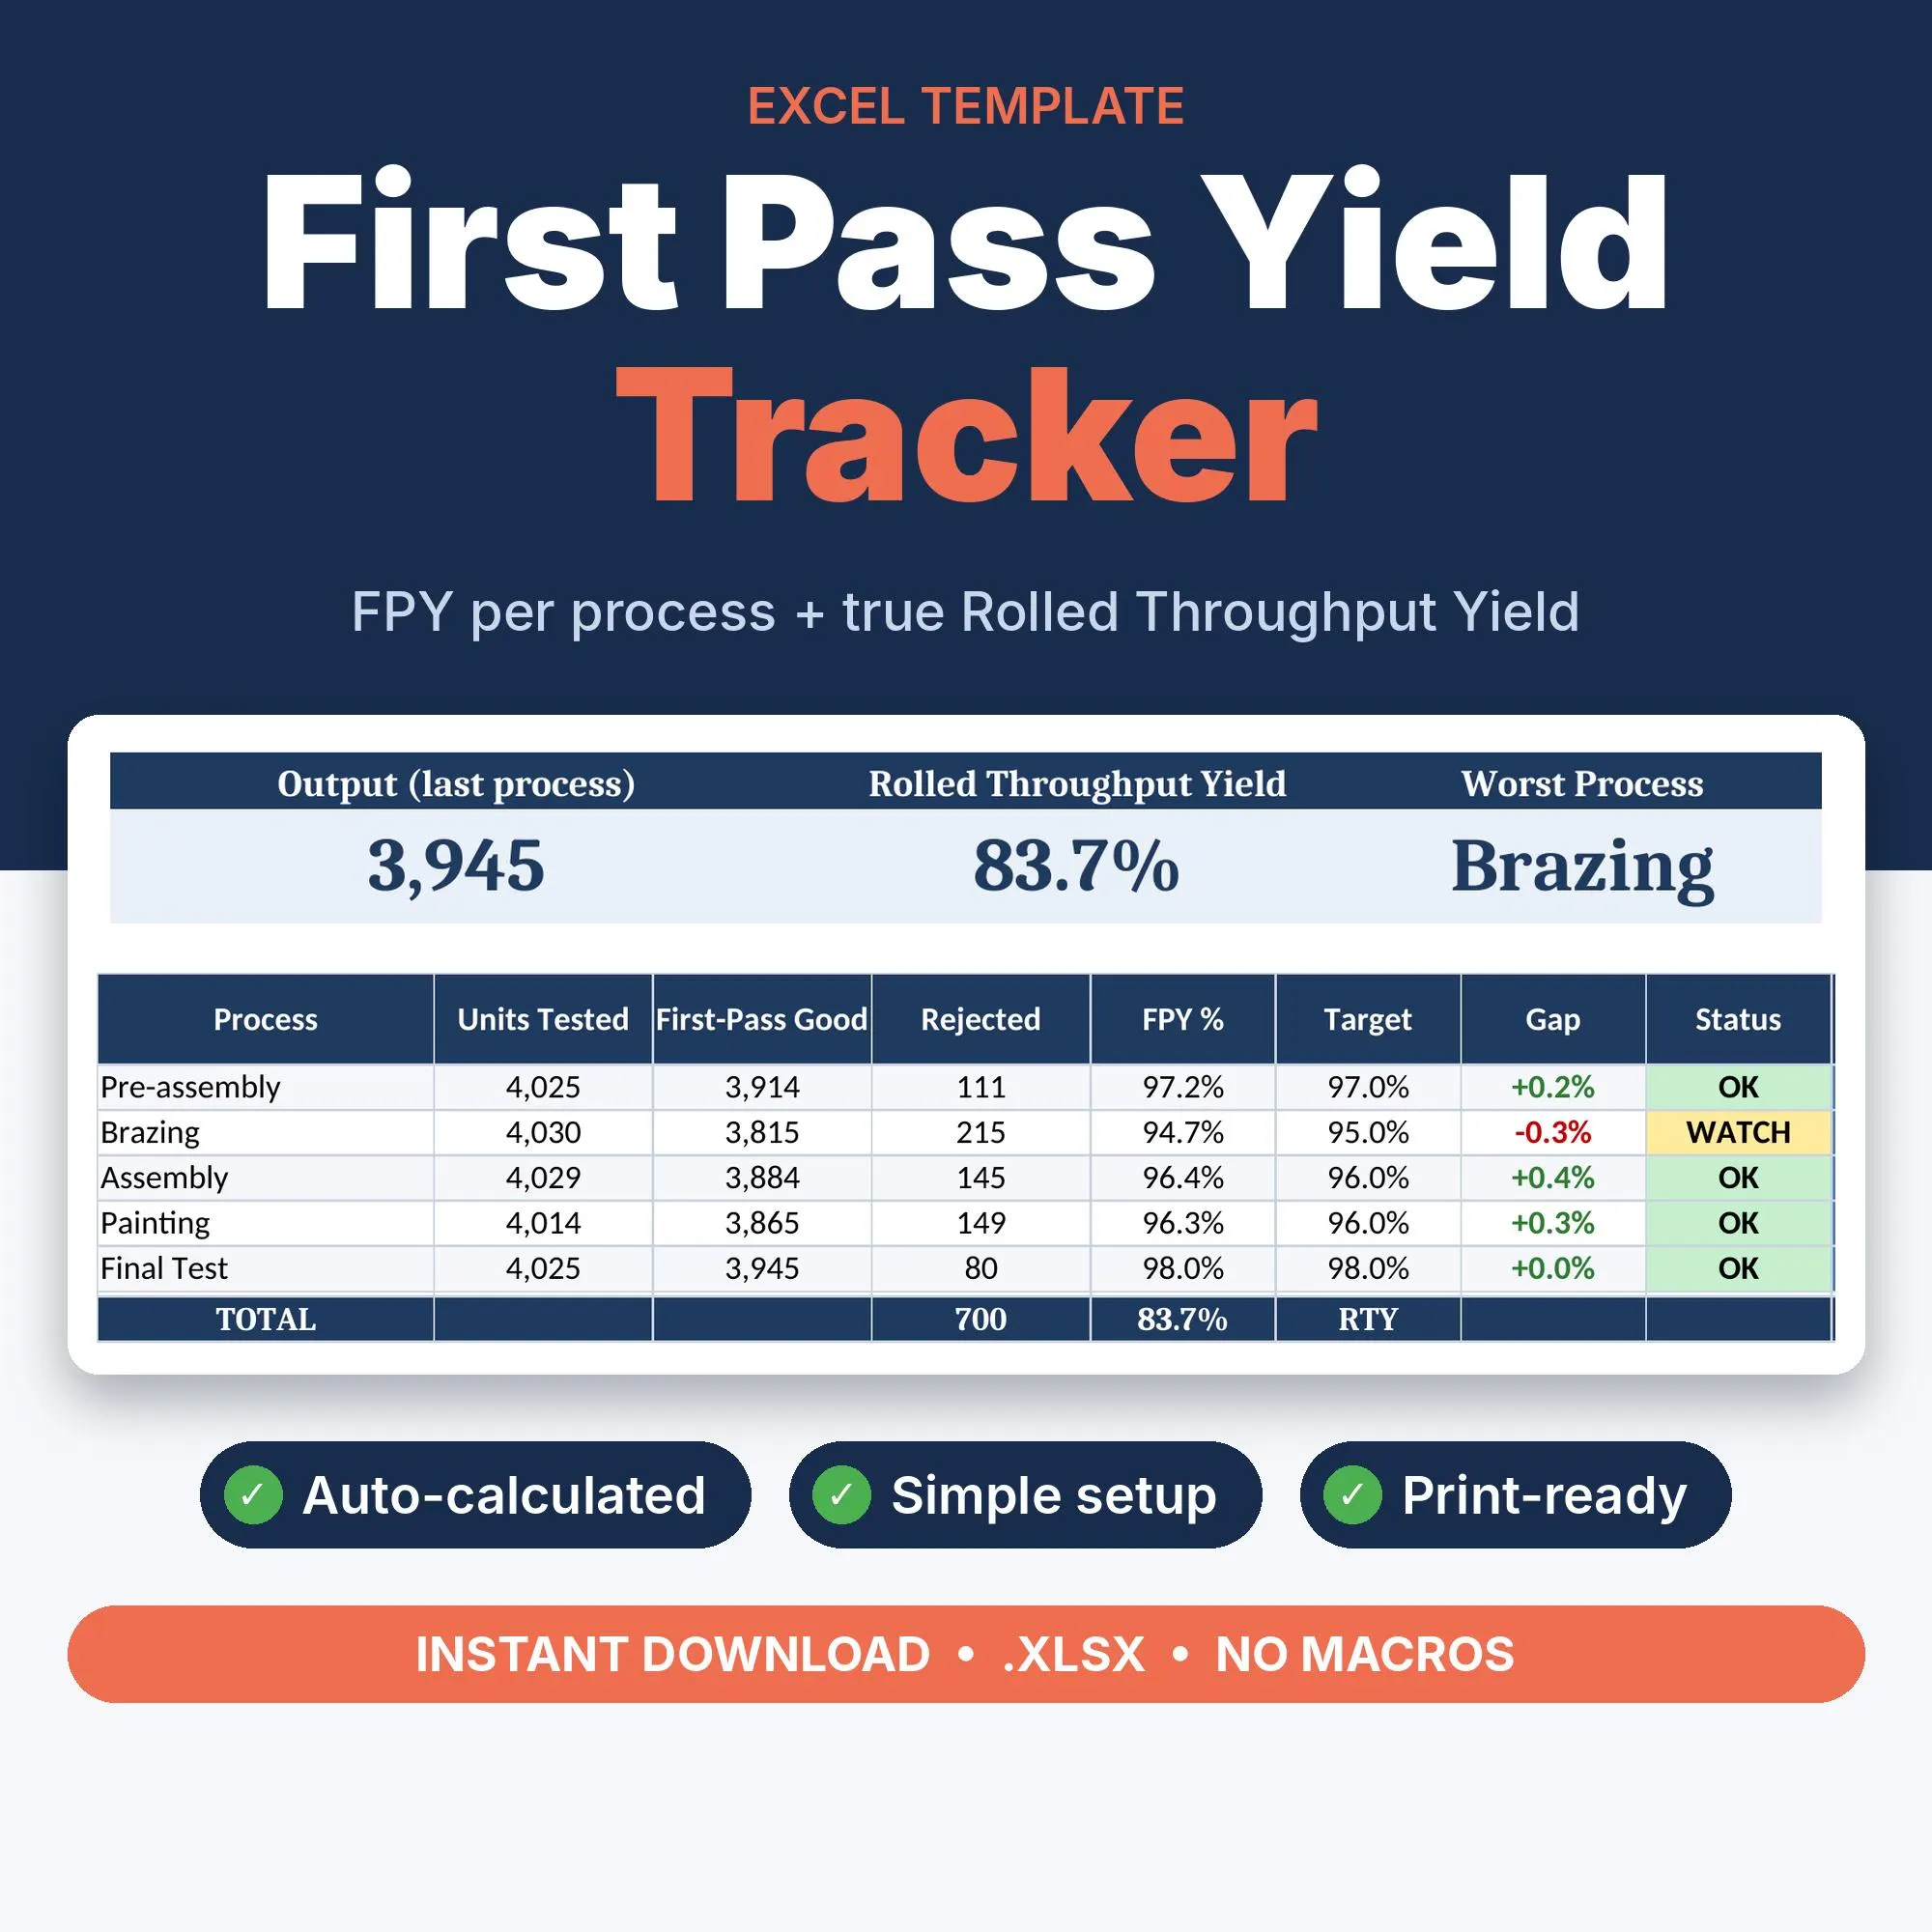
Excel template
First Pass Yield Report
FPY and Rolled Throughput Yield tracker for Excel
Log units tested and first-pass good per process and shift. Excel calculates FPY, the true rolled throughput yield, the gap to target, OK / WATCH / ACTION status and your top defects, on a print-ready one-page report.
- FPY per process and true RTY
- OK / WATCH / ACTION status vs. your target
- Top defects and period filter
- Print-ready one-page landscape report
- No macros, works in Google Sheets
Found it useful? Support the author and see more quality templates on Etsy →
What is inside
- 1
How To Use
Three-step guide and the FPY / RTY definitions, so anyone on the team can fill it in.
- 2
Setup
Company, line, document number, up to 10 processes in flow order with a target FPY each, and the warning band.
- 3
FPY Log
500 ready rows: date, shift, process from a dropdown, units tested, first-pass good and main defect. FPY, target and status calculate automatically.
- 4
FPY Report
Choose a period. Output, rolled throughput yield, worst process and processes in ACTION, the per-process table with gap and status, and top defects.
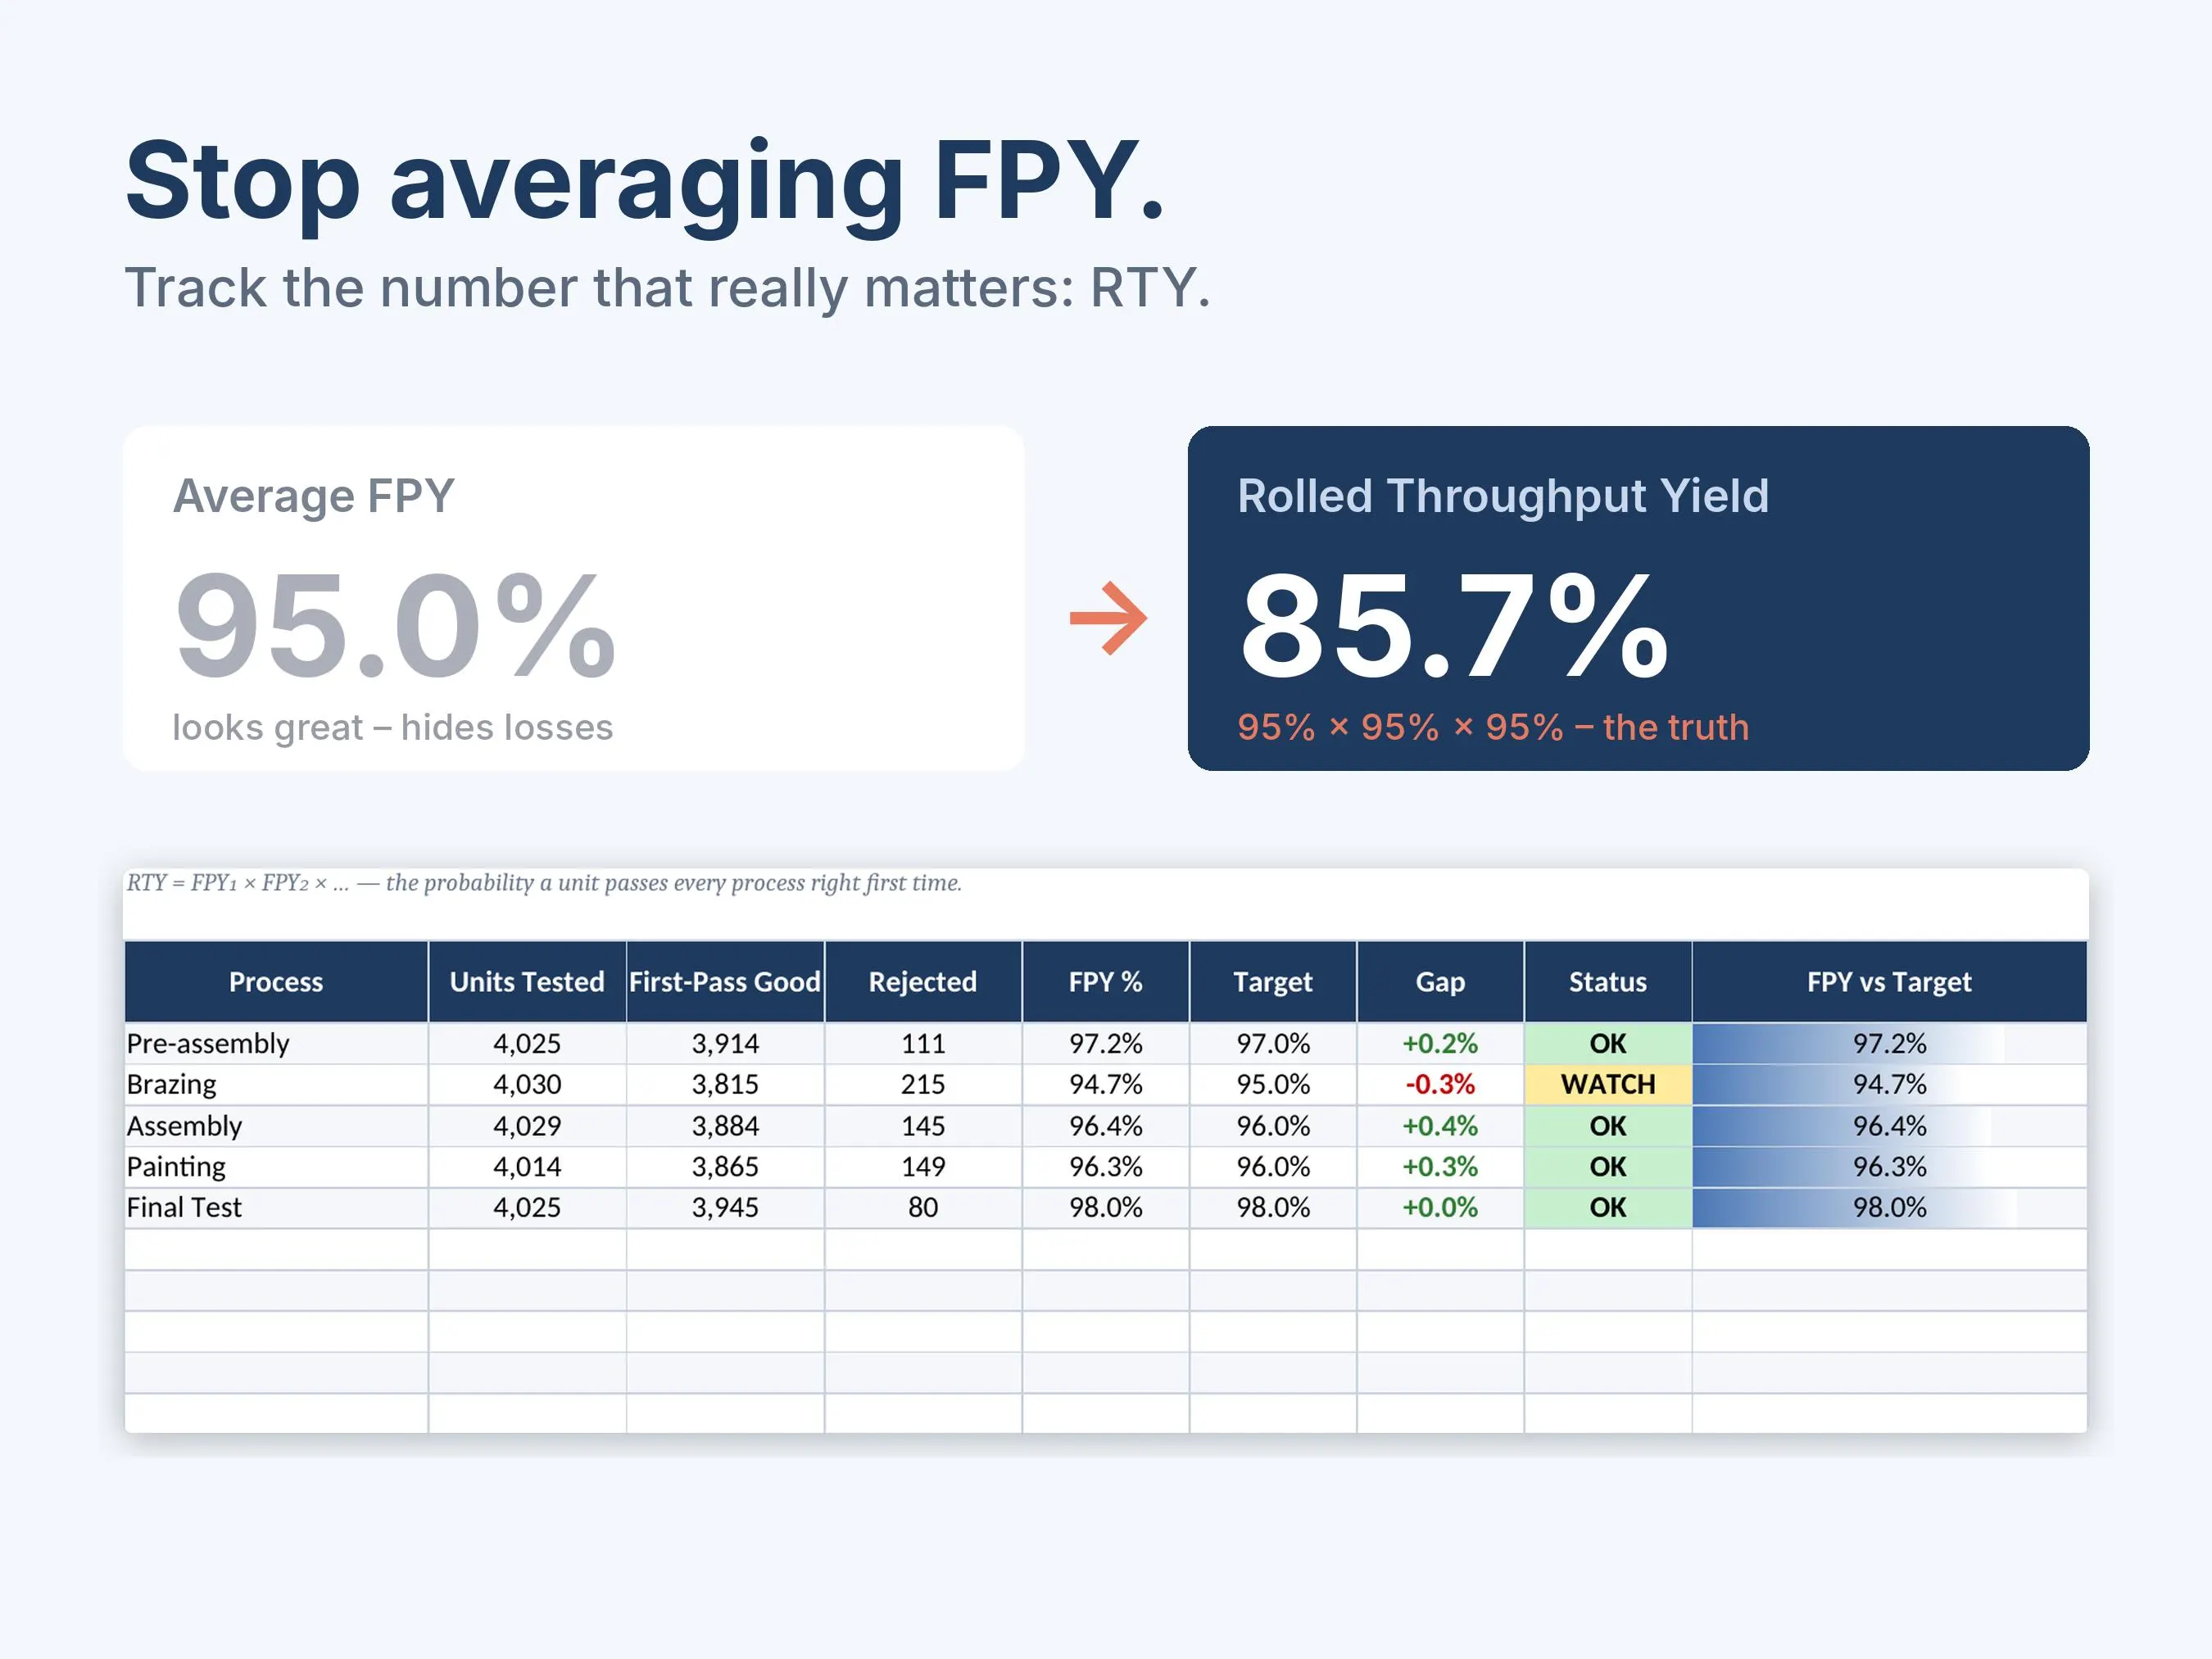
Stop averaging FPY
Three steps at 95 % look like 95 % on average, but only 85.7 % of units pass all three right the first time. The report shows the rolled throughput yield, the number that really matters.
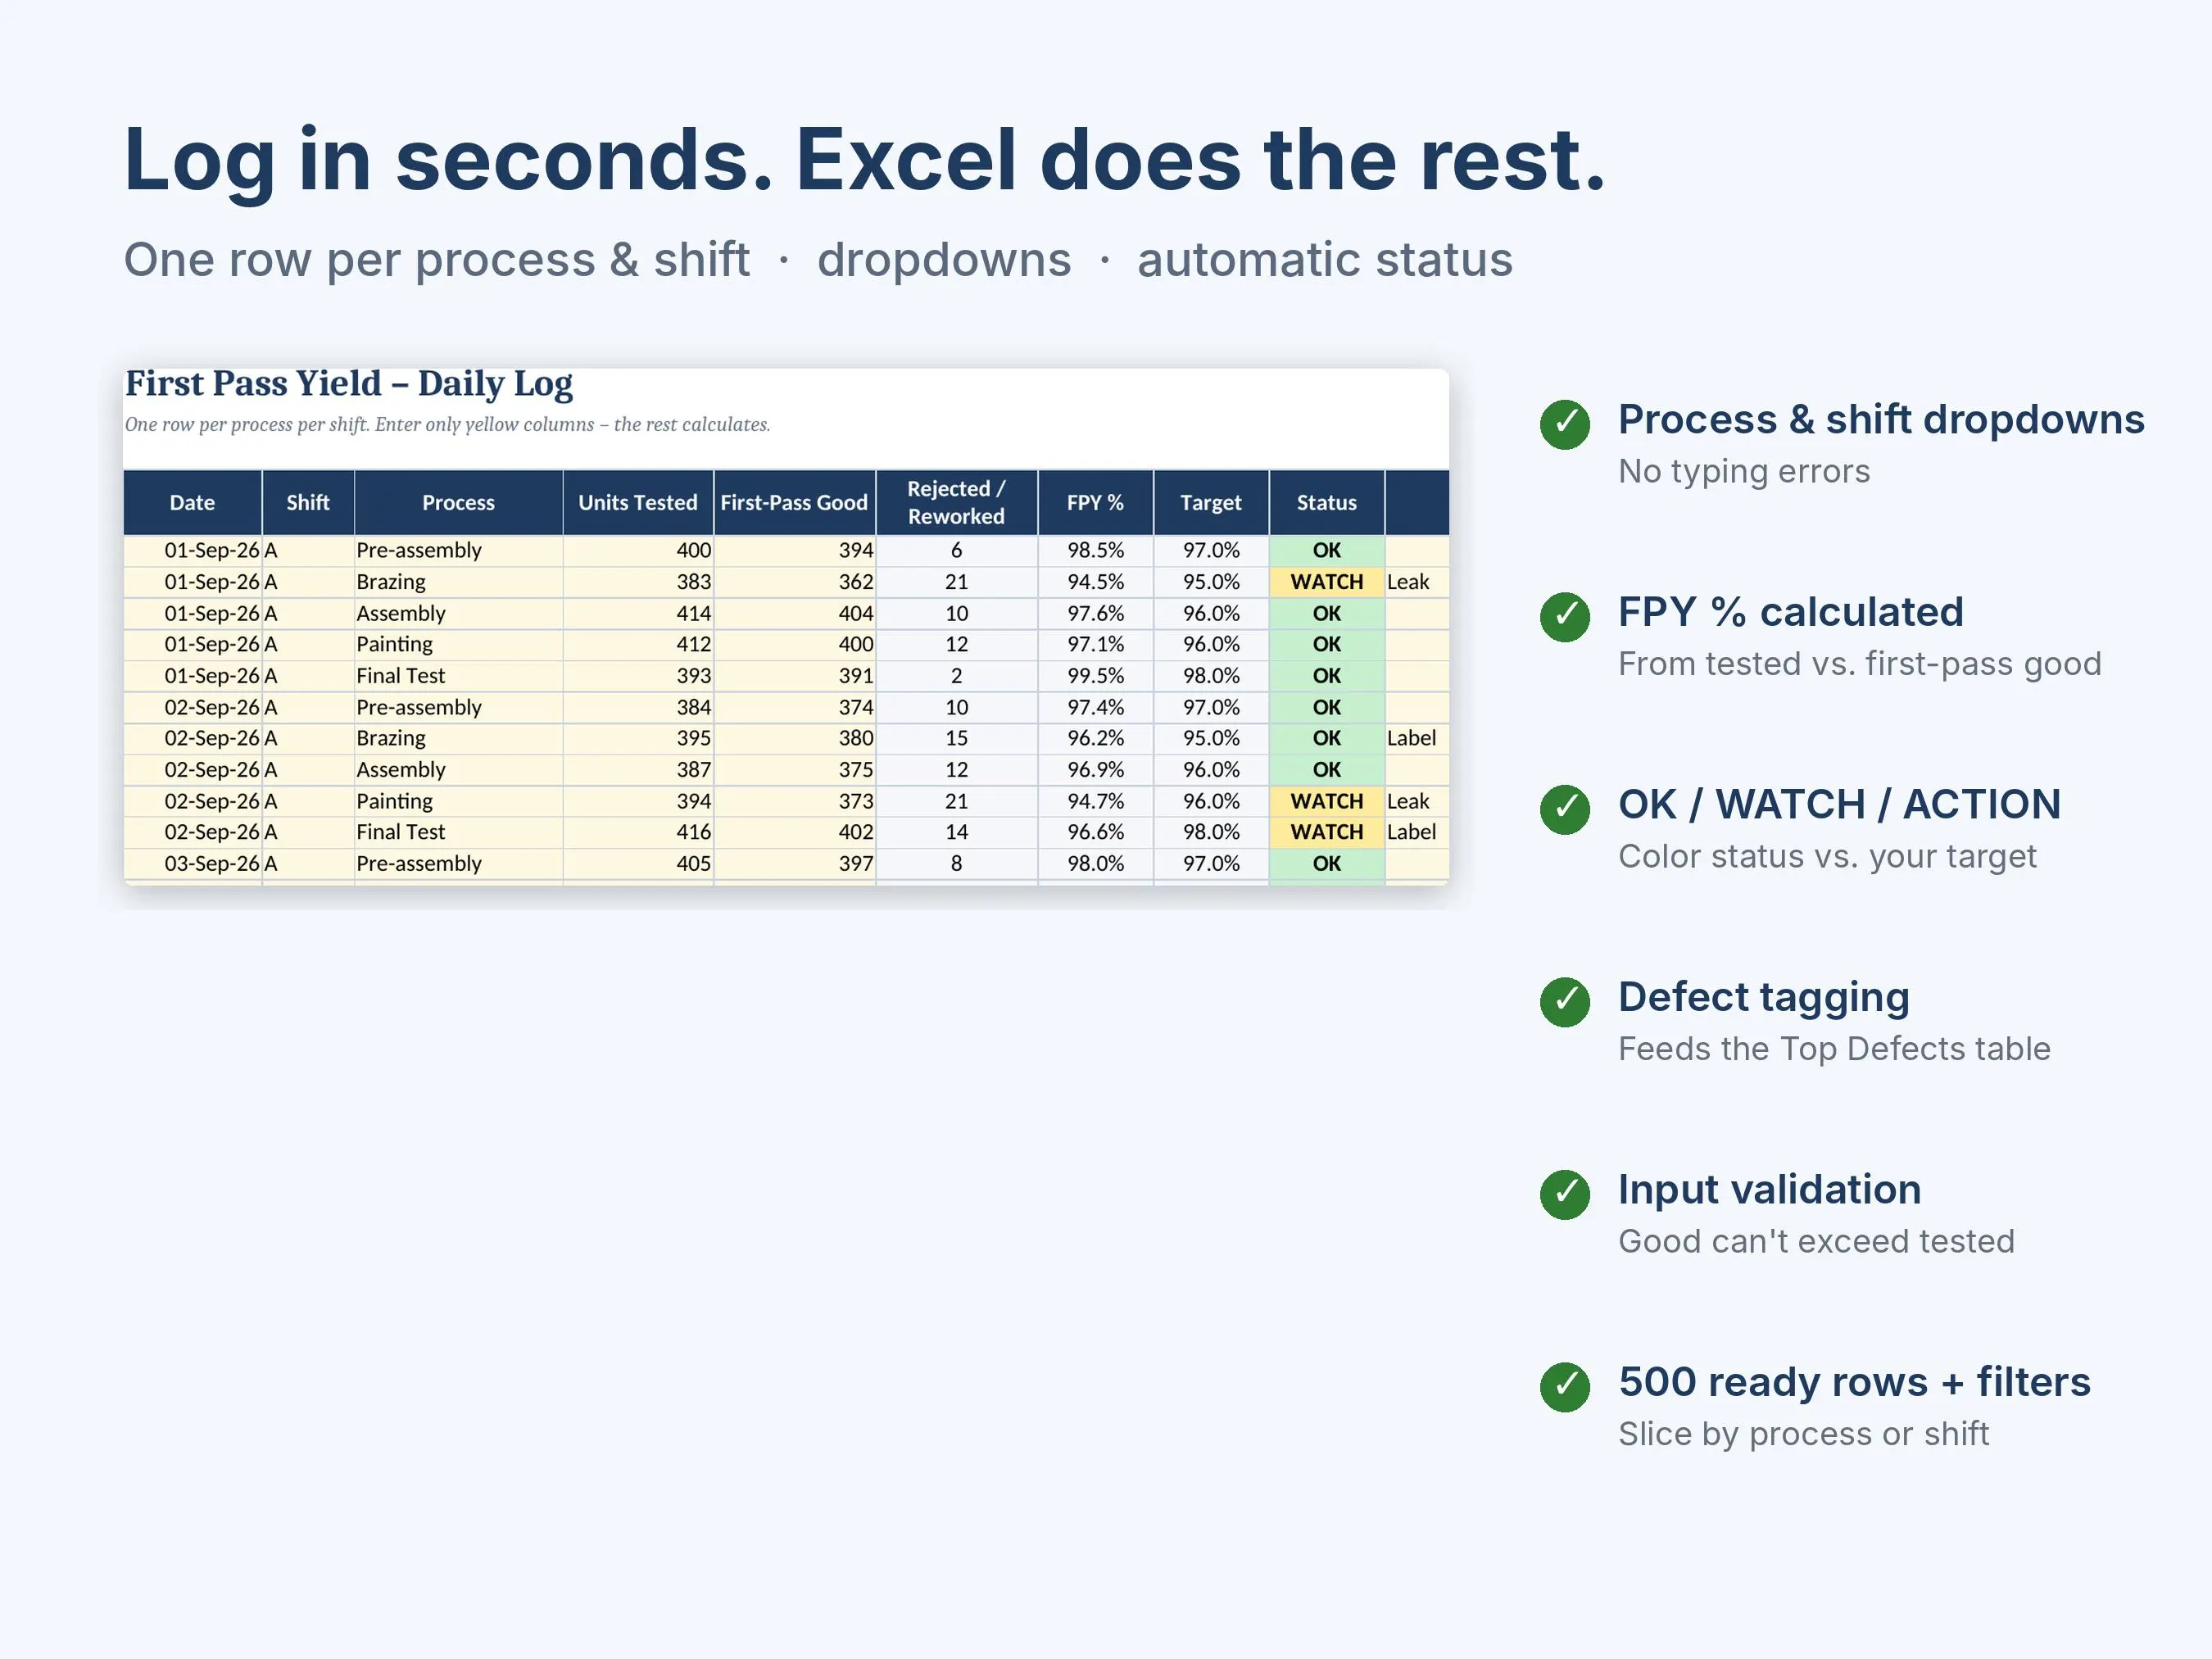
Log in seconds
One row per process and shift with dropdowns for the process, so there are no typing errors. Good can never exceed tested thanks to input validation.
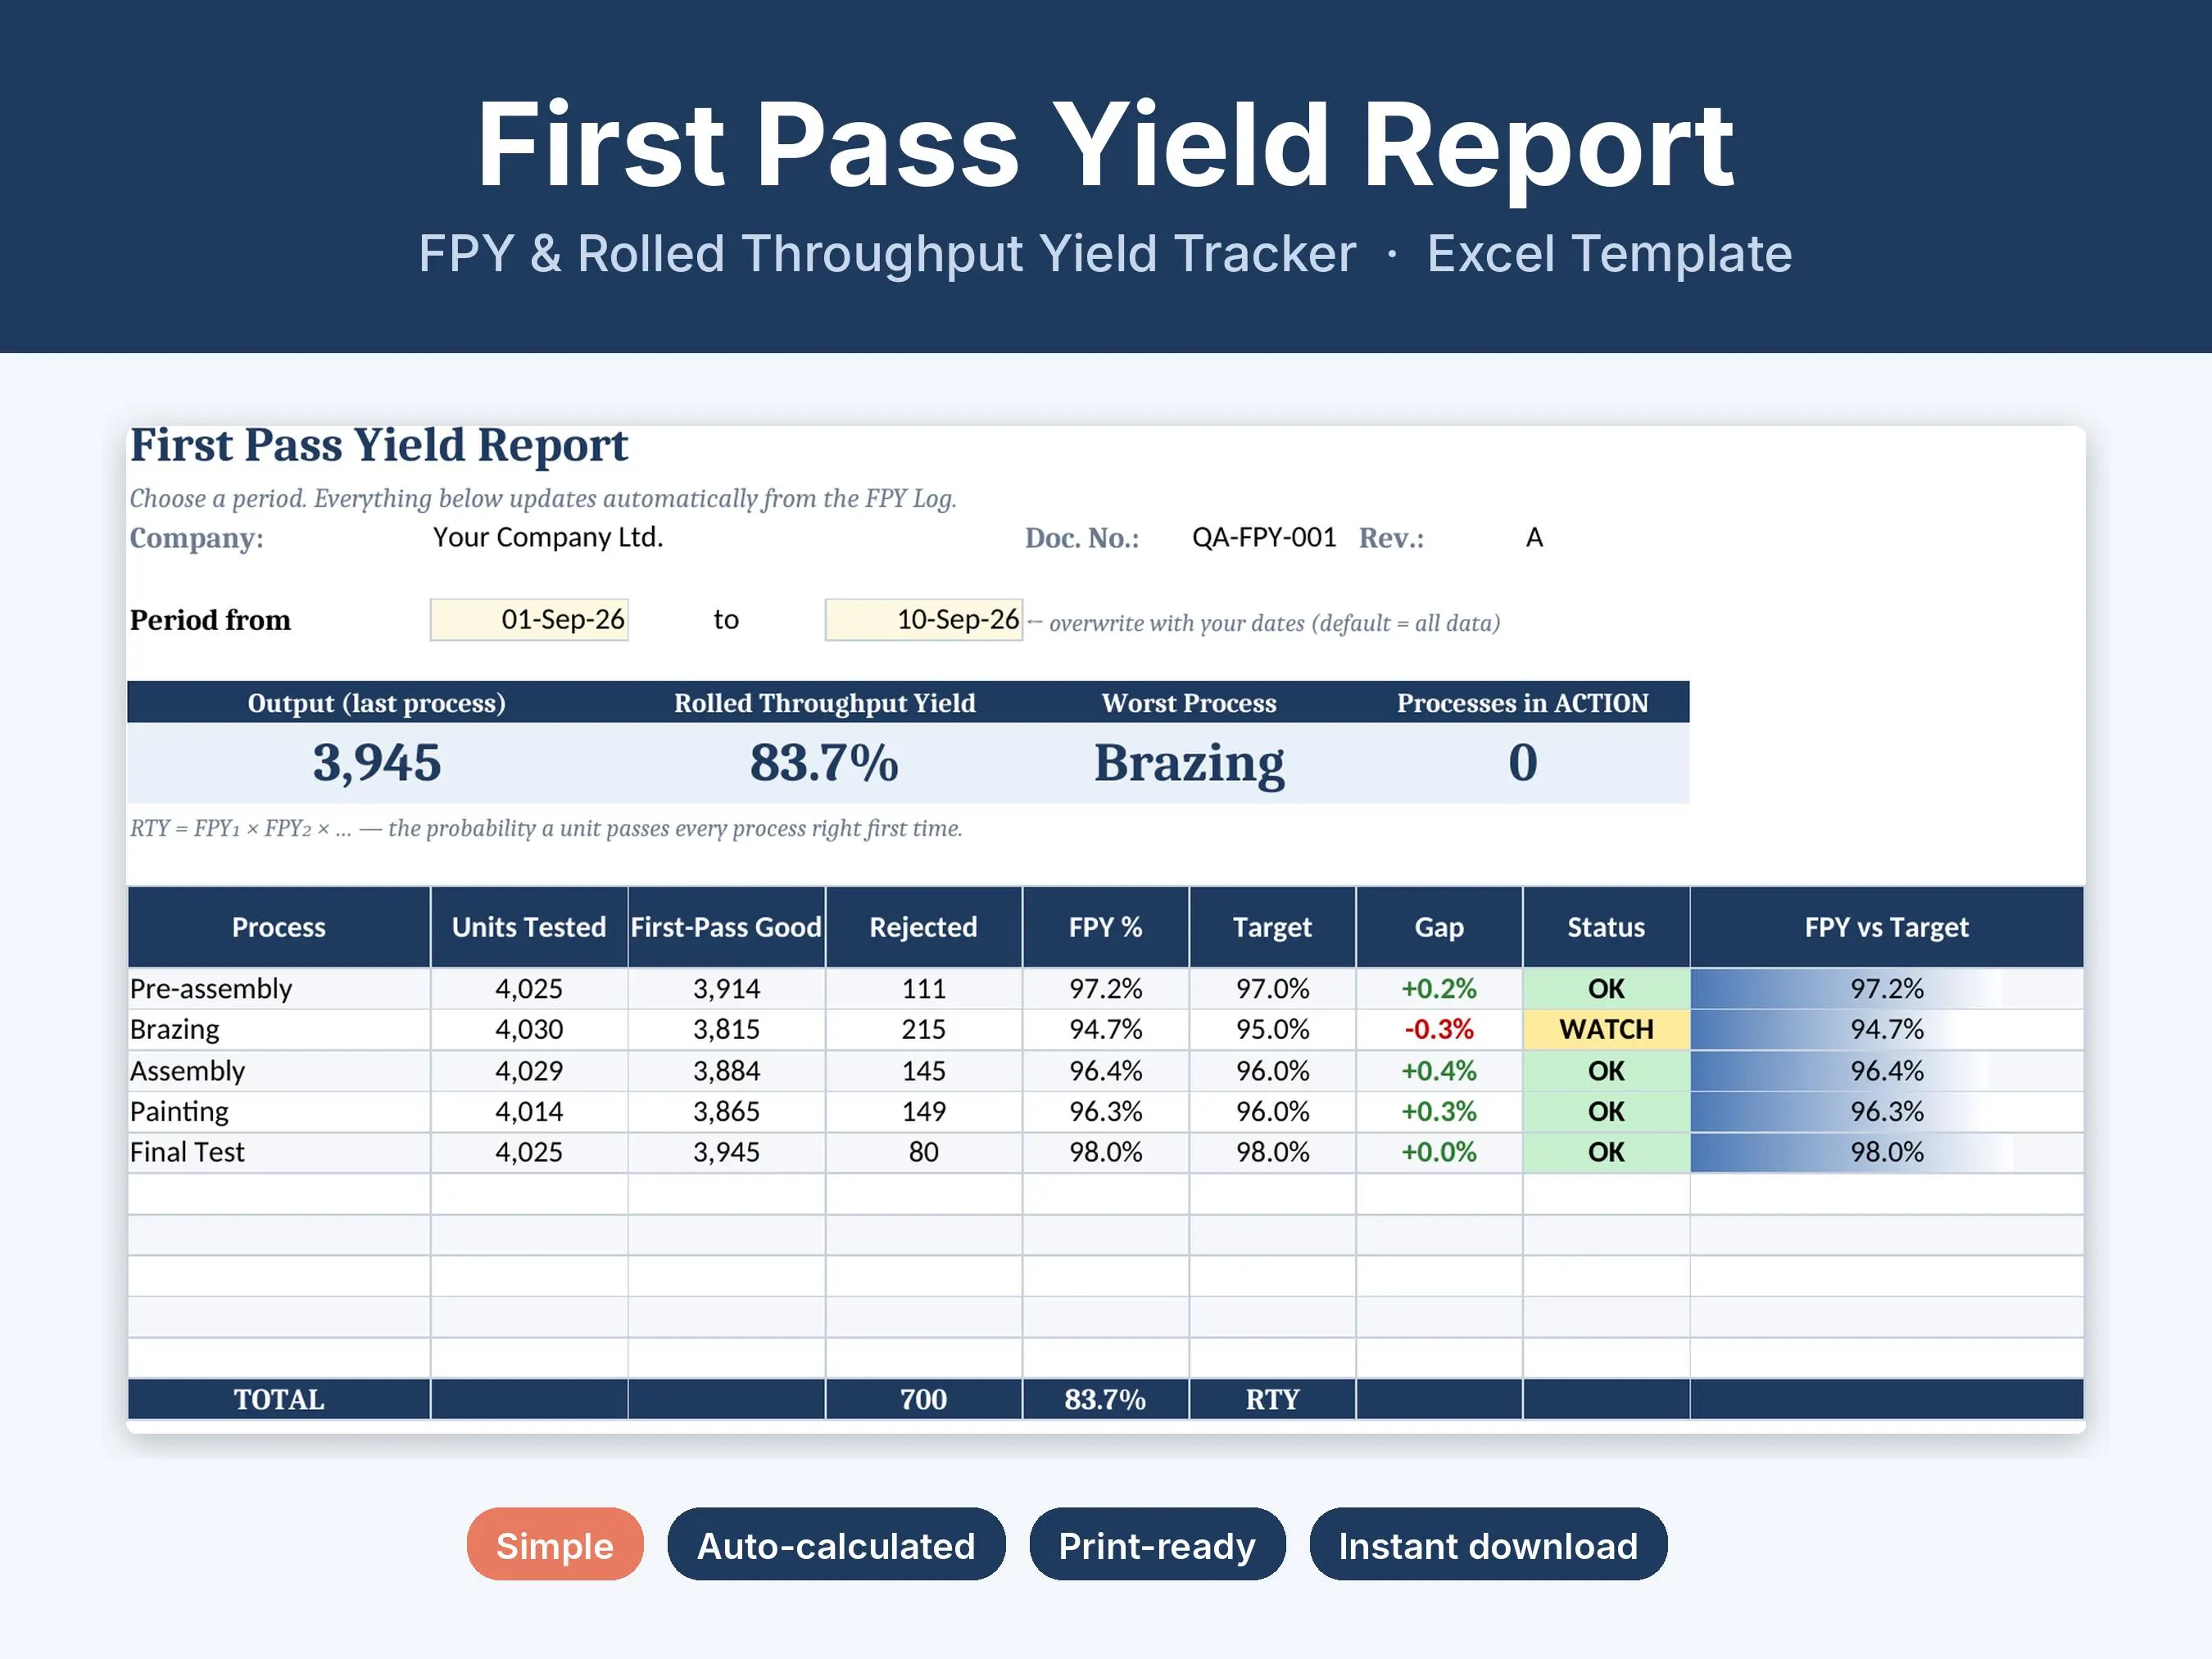
Status at a glance
Every process is compared with its own target: OK at or above, WATCH within the warning band, ACTION below it. Colours make the weak step obvious.
Ready for the meeting
The report prints on one landscape page with company, document number and revision, ready for the daily shop-floor meeting or the customer quality review.
Details
- Format
- Microsoft Excel .xlsx
- Also works in
- Google Sheets, LibreOffice
- Macros
- None
- Processes
- Up to 10
- Log rows
- 500, easy to extend
- Sample data
- Included, delete and start
- Language
- English
- Licence
- Free for use in your company
Frequently asked questions
›Is it really free?
Yes. Download it, use it in your company and adapt it. No sign-up and no e-mail address needed.
›Does it work in Google Sheets?
Yes. Upload the file to Google Drive and open it with Google Sheets. All formulas work; the data bars may look slightly different.
›How do I remove the sample data?
Select the yellow cells in the FPY Log from row 6 down and press Delete. The report updates automatically.
›Can I have more than 10 processes or 500 rows?
Yes. Insert rows inside the existing ranges and the formulas extend with them. For many lines, use one file per line.
›I prefer working online. Is there a web version?
Yes. The free First Pass Yield calculator on QM Bench does the same in your browser, with charts and a PDF report.
Start tracking first pass yield today
Free download, no sign-up. Delete the sample data and enter your own processes.
Download the free ExcelLike it? Support the author: more templates on Etsy →