Excel template
Run at Rate & Capacity Verification
Plan the capacity, run the line under series conditions, log every stop and every hour, and get a one-page decision: approved, approved with actions or not approved
Launch offer: −20 %(€12.00 instead of €15)with code LAUNCH20 at checkout, until 30 November.
Run at rate and capacity verification workbook for automotive launches: customer requirement profiles (AIAG PPAP, Ford, GM, Stellantis, VW 2-day production, VDA 2), capacity plan for 20 operations with shared equipment, 18 run-validity checks, 300-line downtime log, hourly log, availability, performance, first-time quality, OEE and demonstrated capacity per operation, Ppk of special characteristics, run history and an action plan. Example and blank file, no macros.
- One decision: APPROVED, APPROVED WITH ACTIONS or NOT APPROVED, with every check spelled out
- Requirement profiles: AIAG PPAP, Ford, GM, Stellantis, VW 2-day production, VDA 2, internal or custom
- Capacity judged against APW or MPW, per week and per day
- Capacity plan for 20 operations, shared equipment by allocation %
- 18 run-validity checks, critical and non-critical, with evidence
- OEE and demonstrated capacity per operation, bottleneck found automatically
- Downtime log for 300 stops with Pareto, hourly log with rate chart
- Run history: run 1, 2, 3 in one file
Secure checkout by Polar. Digital download: at checkout you agree to immediate delivery and waive the 14-day withdrawal right, so downloads are not refunded. Support: info@qmbench.com.
Free alternativeTry the free online tool firstThe free Run at Rate Calculator on QM Bench runs in your browser with a PDF report. The template is for a file you keep, edit and fill with your own data.Open the free toolWhat is inside
- 1
Start Here
How to run it, every formula explained and where run at rate is required.
- 2
Setup
Customer requirement profile, APW / MPW, series working pattern, net time and takt.
- 3
Capacity Plan
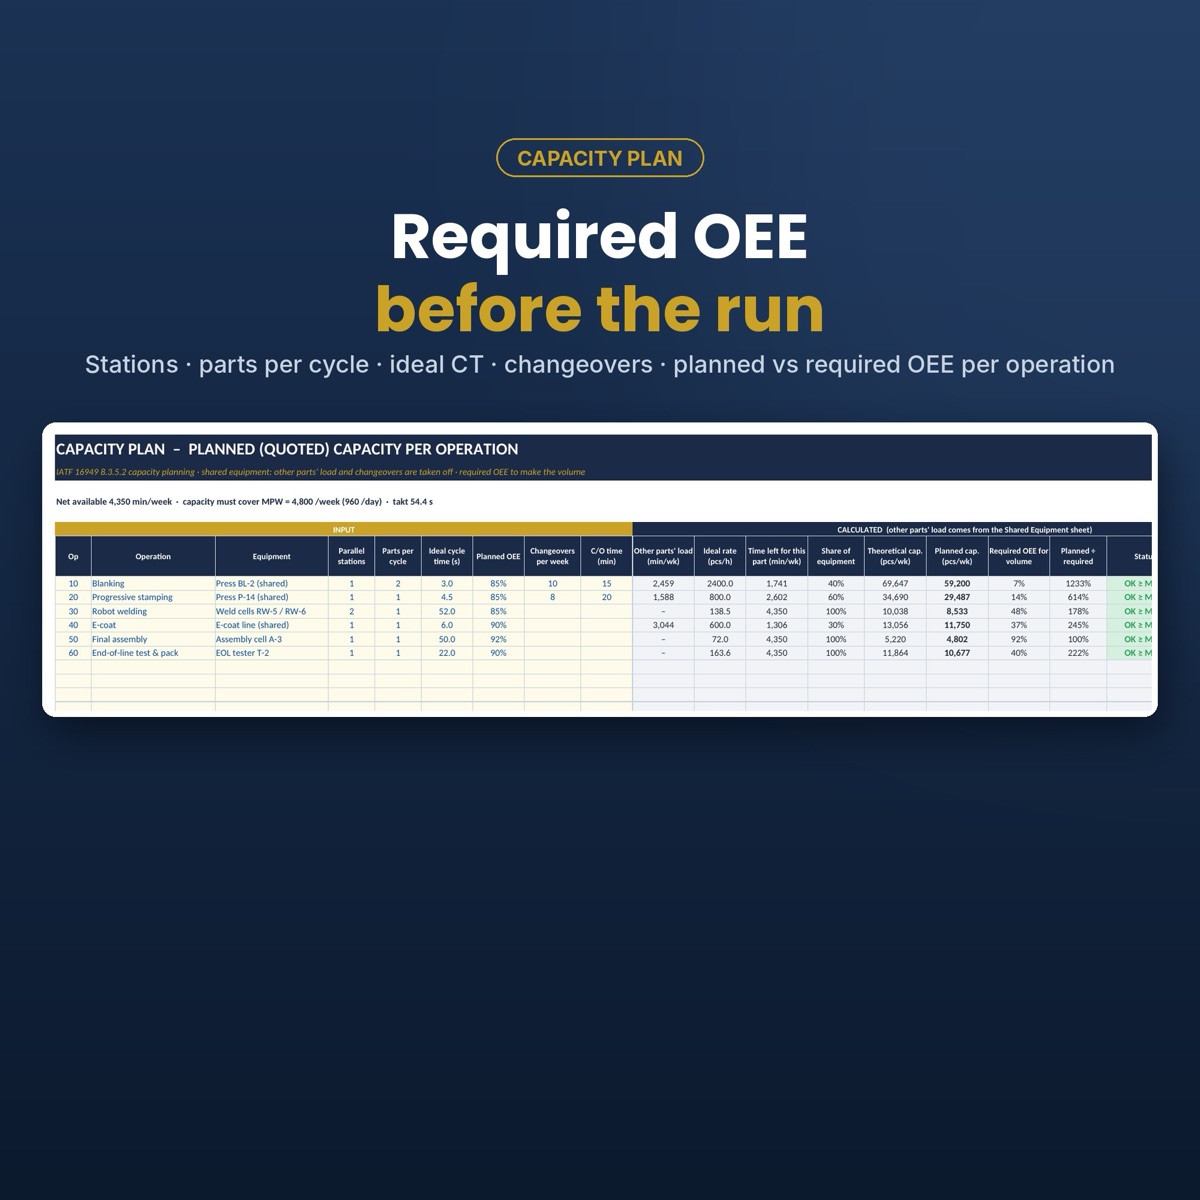
20 operations: stations, parts per cycle, ideal cycle time, planned OEE, theoretical and planned capacity, required OEE.
- 4
Shared Equipment
Allocation of machines shared with other parts.
- 5
Run Conditions
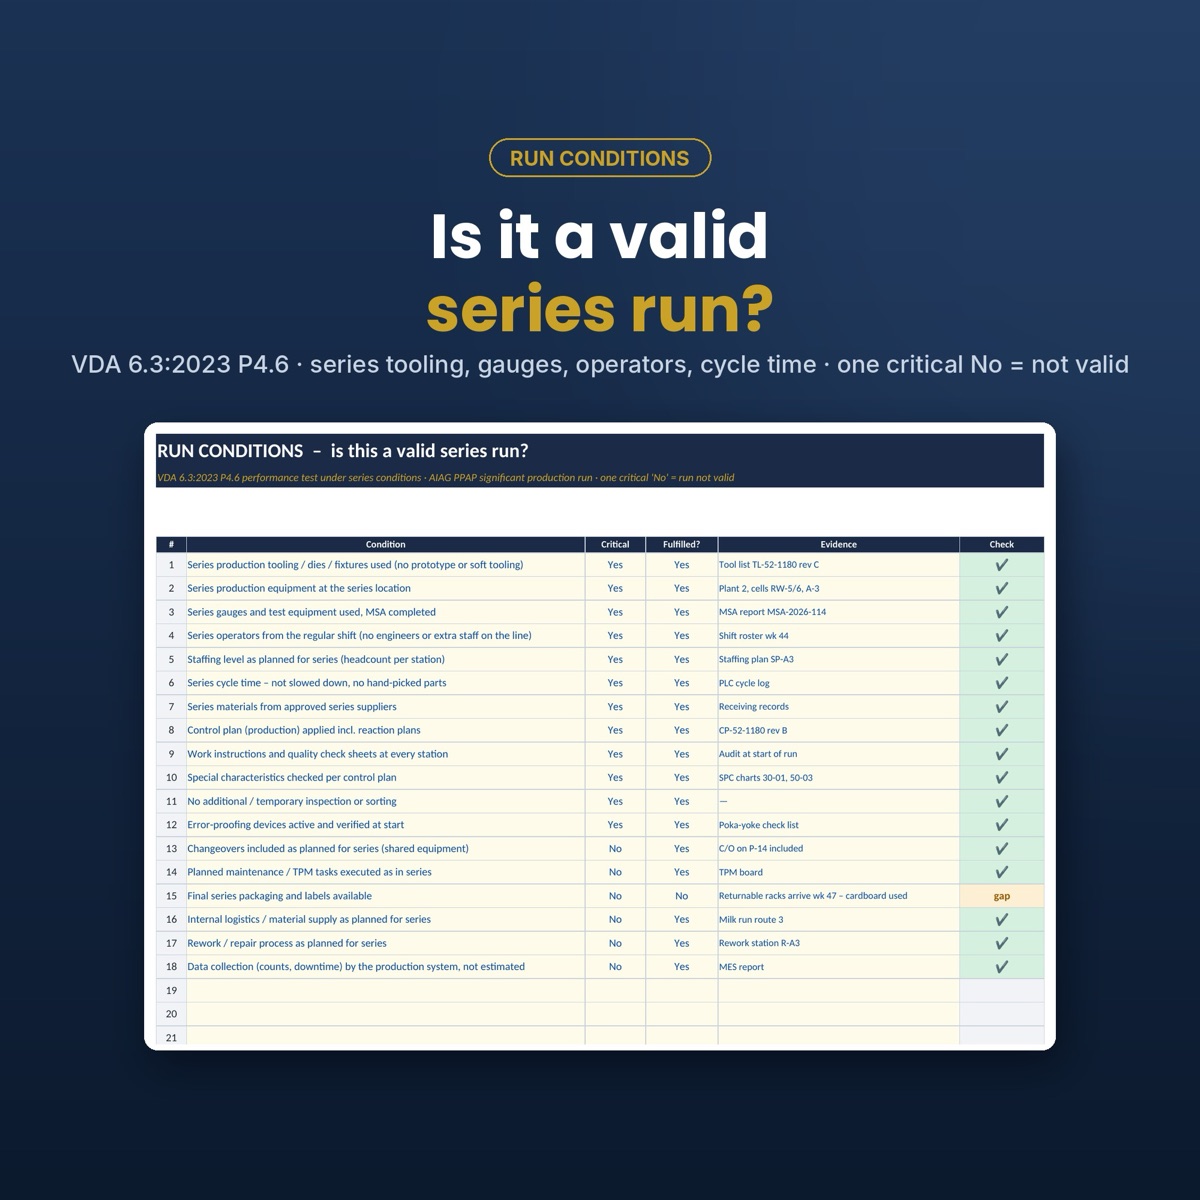
18 validity checks (series tooling, gauges, operators, cycle time, control plan…), critical or non-critical, with evidence.
- 6
Downtime Log
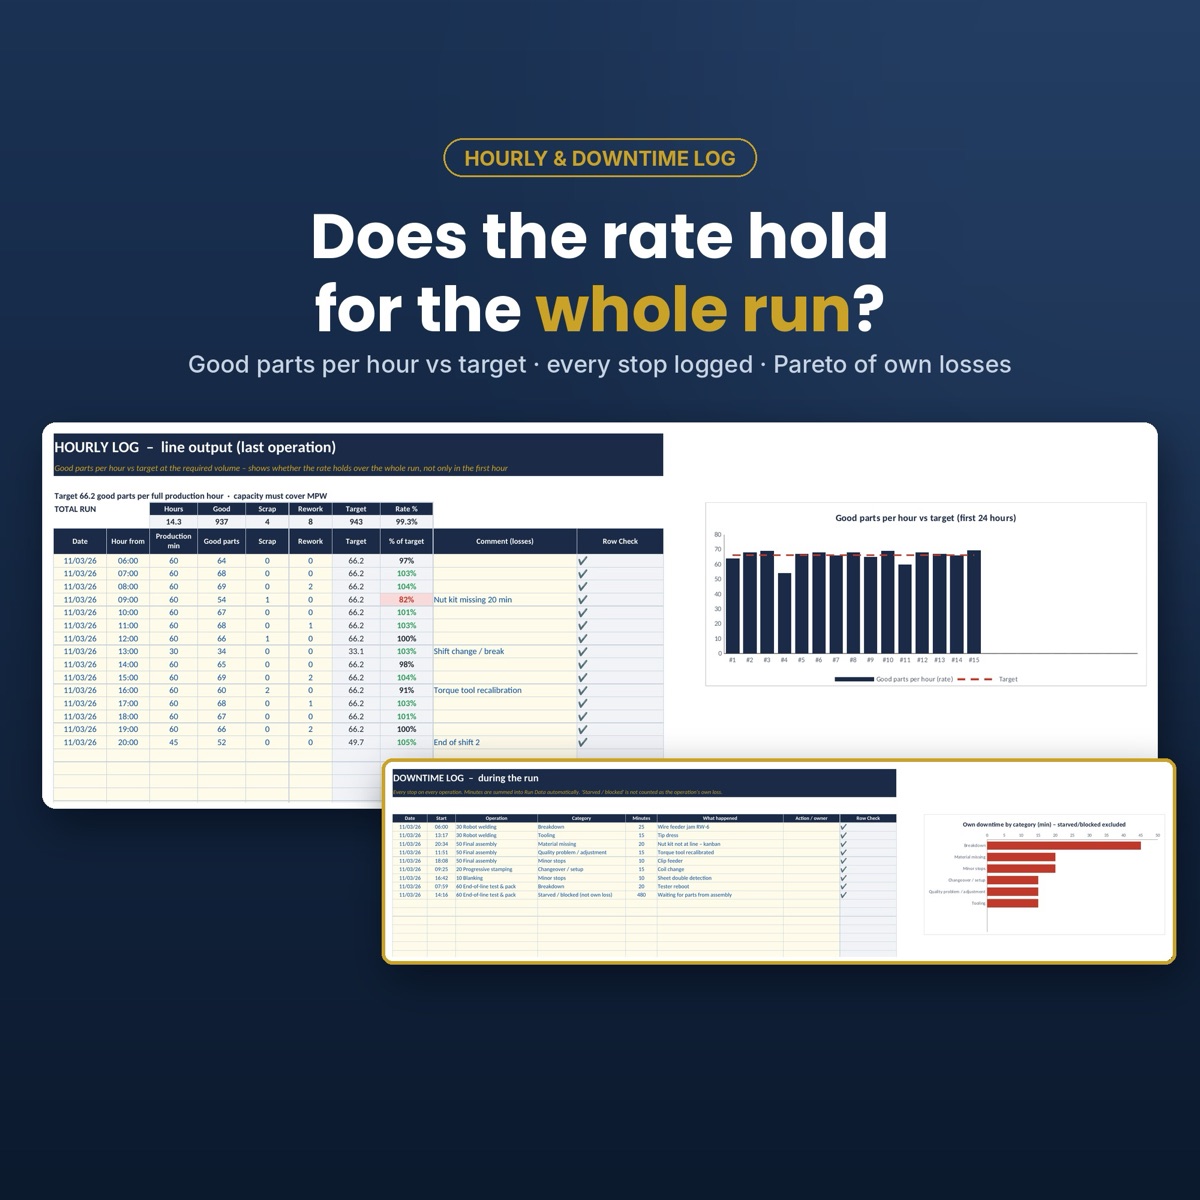
300 lines, category Pareto, starved and blocked time kept apart.
- 7
Hourly Log
Good parts per hour against the target, rate chart, duration and consecutive-part checks.
- 8
Run Data
Availability, performance, first-time quality, OEE and demonstrated capacity per operation, PASS / CONDITIONAL / FAIL.
- 9
Quality Results
Ppk / Cpk of the special characteristics from the run.
- 10
Report
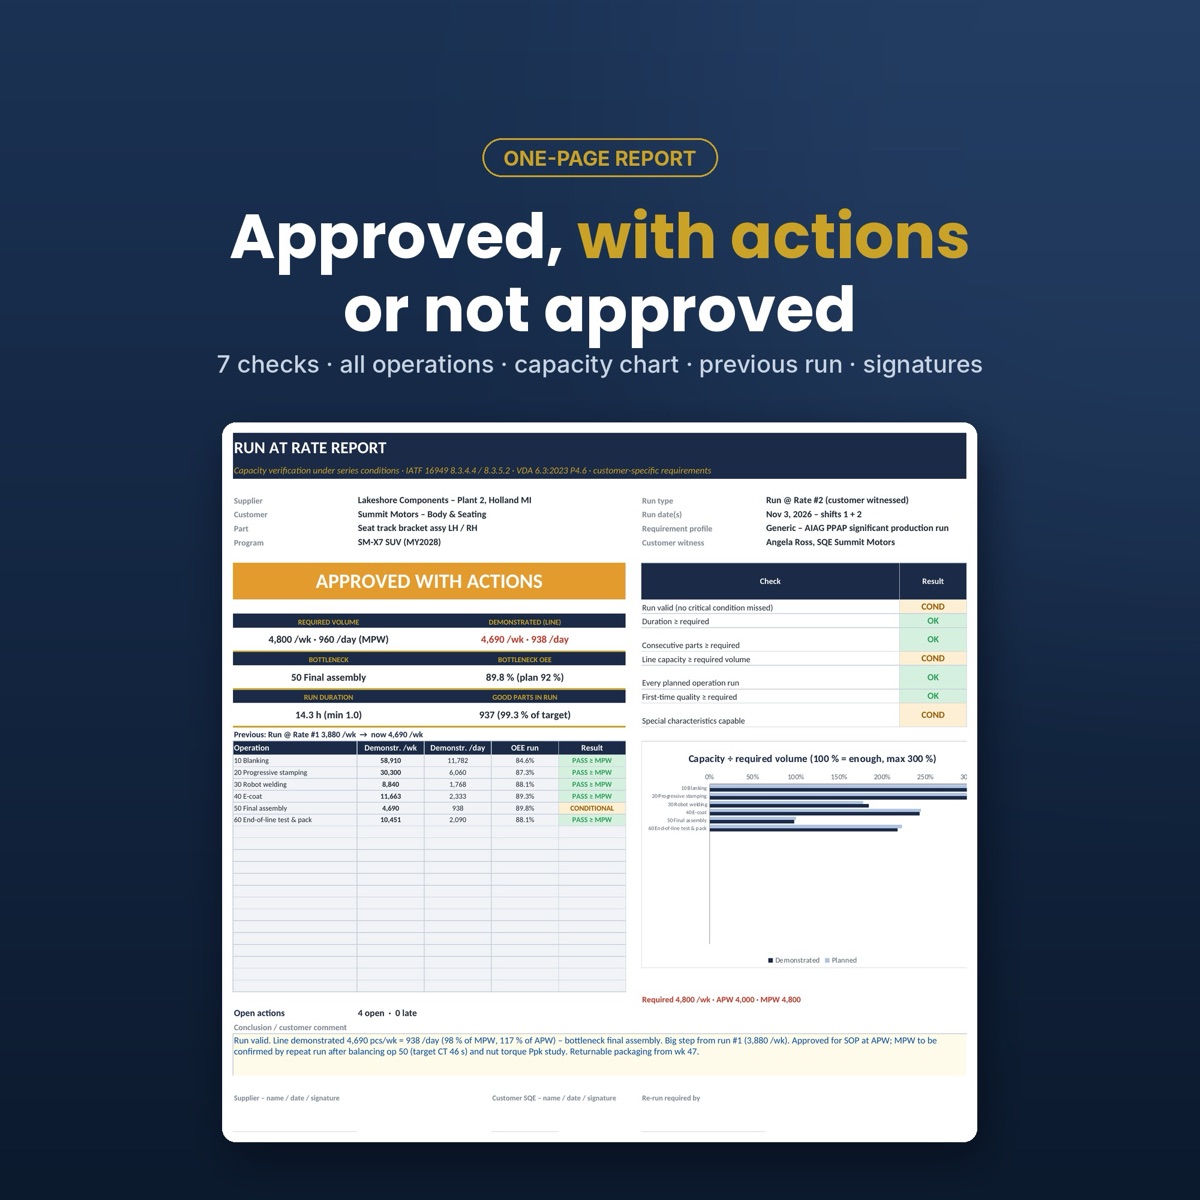
One printable page: decision, 7 checks, bottleneck, capacity chart, conclusion and signatures.
- 11
Run History
Freeze each run with one paste and see the progress to the required volume.
- 12
Action Plan
25 actions with owner, date, status and days late.
Plan before the run
Enter the customer volume, the working pattern and every operation with its cycle time and parts per cycle. The capacity plan shows theoretical and planned capacity per operation and the OEE each one needs to reach the volume, so you see the weak operation before the run, not after it.
Is the run valid at all?
A run at rate counts only under series conditions: production tooling, released gauges, trained operators, the planned cycle time, the control plan in use. 18 checks, each critical or not, with the evidence. A missed critical condition makes the run invalid, whatever the numbers say.
Every stop and every hour
Log each stop with its category in the downtime log and the good parts in the hourly log. Starved and blocked time are kept apart, so a waiting machine is not blamed for its neighbour. The duration and consecutive-part requirements are checked from the hourly log.
One page for the customer
The report shows the decision, the seven checks, demonstrated capacity per operation against APW or MPW, the bottleneck and its OEE, the previous run, the conclusion and signature fields. Print it or save it as PDF for the PPAP file.
Who it is for
- Launch, APQP and quality engineers at automotive suppliers
- Supplier quality engineers (SQE) witnessing runs at suppliers
- Plant managers preparing SOP and capacity reviews
- VDA 6.3 and IATF 16949 auditors and consultants
Not included
- An OEM form: it does not replace a customer's mandatory tool (for example the Ford Capacity Analysis Report)
- Profile values are typical defaults: confirm them with your customer's CSR
- The text of IATF, VDA or AIAG standards
Details
- Format
- Microsoft Excel .xlsx, 2 files (example + blank), 13 tabs
- Works in
- Excel 2010 or newer, Excel 365, Excel for Mac, LibreOffice Calc
- Macros
- None, no add-ins
- Capacity
- 20 operations, 300 downtime lines, 25 actions
- Profiles
- AIAG PPAP, Ford, GM, Stellantis, VW 2-day production, VDA 2, internal, custom
- Example
- 6-operation bracket line, 2-shift run, fictional data
Frequently asked questions
›Where do I buy it?
Here on QM Bench with the Buy button: secure card checkout by Polar with a receipt, and both Excel files arrive by e-mail right after payment.
›What is the difference between APW and MPW?
APW (average weekly volume) is the planned customer demand; MPW (maximum weekly volume) is the peak the customer wants you to be able to deliver. Many customers judge the run against MPW. The template lets you choose which one the line must reach.
›Which customer requirements does it cover?
Profiles for AIAG PPAP significant production run, Ford, GM, Stellantis, VW 2-day production, VDA 2 and internal runs set the duration, the number of parts and the volume to judge against. They are typical defaults: always check your customer's current CSR and change the values in Setup if needed.
›How is the bottleneck found?
For every operation the run data give availability, performance and first-time quality, so OEE and demonstrated capacity per week and per day. The operation with the lowest demonstrated capacity is the bottleneck and sets the line capacity.
›Can I keep several runs in one file?
Yes. When a run is closed, copy the live line in Run History and paste it as values into the next empty row. The input sheets can then be reused for the re-run, and the chart shows the progress against the required volume.
›Is there a free version?
The free online run at rate calculator on QM Bench gives demonstrated capacity, OEE and the gap to demand for a single run. The Excel template adds the capacity plan, run validity, logs, quality results, report and history.
›Can I get a refund?
No. It is a digital download: at checkout you agree to immediate delivery and waive the 14-day right of withdrawal, and the files stay with you. If something does not work as described, write to info@qmbench.com and you will get help or a corrected file.
Get the Run at Rate & Capacity Verification
Instant download by e-mail after payment. Paste your measurements and read the verdict.
Buy now · €15Or try the free online tool first →